The rise of non-performing loans (NPLs) is a salient feature of financial crises. The recent global recession was no exception – within the EU alone, the volume of NPLs relative to GDP more than doubled between 2009 and 2014. Developing markets are now grappling with similar difficulties. In 26 countries, the ratio of non-performing loans to total loans (the NPL ratio) altogether exceeded 10% in 2015 according to the World Bank data.
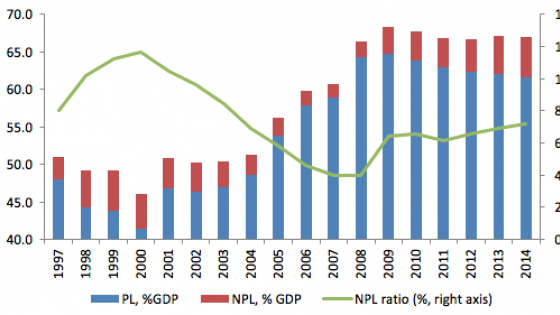
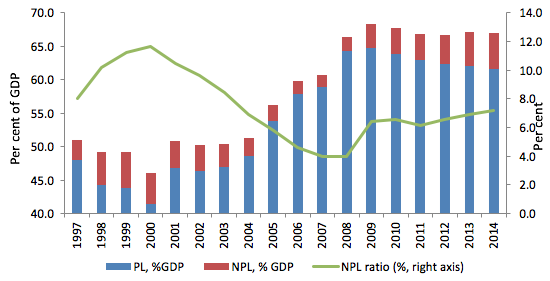
The rise in bad debt during times of financial distress is problematic, but predictable. What makes the current situation different is the strong persistence of NPLs (see the discussion in IMF 2016, for example). After the Asian crisis of 1997-98, the average NPL ratio declined swiftly throughout the 2000s; after the 2008-09 crisis the average NPL ratio has been edging up steadily (Figure 1).
Figure 1. Average NPL ratio, performing loans and NPLs as per cent of GDP
Note: Average based on data for 100 countries, see Balgova et al (2016).
The concern is that persistently high NPLs lock in the sluggish nature of recovery. For borrowers, delays in debt repayment make obtaining further credit more difficult, which often leads to a second round of debt default and firm bankruptcy. Lenders are affected, too. A bank plagued with a high stock of NPLs is likely to focus on internal consolidation and improving asset quality rather than providing new credit (Leon and Tracey 2011). A high NPL ratio requires greater loan provisions, which reduces capital resources available for lending, and dents bank profitability. There is evidence that high NPL stock is a significant predictor of bank failure, and distorts bank’s cost structure and efficiency (Lu and Whidbee 2013, Maggi and Guida 2009, Cucinelli 2015). An example of such distortions is the case of ‘zombie lending’ by Japanese banks to save corporations plagued by bad debt, which led to misallocation of capital and slowdown of economic growth during the early 1990s (Caballero et al. 2008).
Yet the evidence on the magnitude of the impact of build-up in NPLs is scarce, in part because NPLs themselves are a consequence of weak growth (see for example Beck et al 2013). Vector autoregression analysis (Kaminsky and Reinhart 1999, Nkusu 2011) provides some estimates, but does not distinguish between increases in NPLs and NPL reductions or look at the underlying drivers of reductions in NPLs.
To address these issues, we focus on episodes of high and persistent NPLs and identify different types of NPL reduction episodes during 1997-2014 in a broad sample of 100 countries (Balgova et al. 2016). This enables us to focus on the instances of substantial reductions in the NPL ratio (of at least 7 percentage points) that need not have the same economic impact as NPL increases or small fluctuations in the NPL ratio.
We further distinguish between ‘passive’ reduction episodes that are driven mostly by the expansion in new credit, and ‘active’ episodes where at least 60% of the reduction is driven by a drop in the stock of NPLs. The ‘control’ group are episodes of ‘procrastination’ when an NPL ratio of at least 7% persists for at least three consecutive years without a downward trend.
To check that active NPL reductions reflect policy choices and active measures taken as opposed to generally favourable economic conditions, we construct a novel dataset of narrative evidence on various episodes drawing on reports by governments and international bodies, as well as academic literature. Active measures range from creation of specialised asset management companies with public capital or restructuring involving bad banks and good banks (a policy deployed by Sweden in the early 1990s and adopted later by Mexico, China, and others), to the establishment of centralised out-of-court debt workout programme (used, for instance, by the governments of Korea, Thailand, Indonesia, and Malaysia in the 1990s), to creating tax incentives for NPL write-offs.
It turns out that in only nine cases did episodes of NPL reduction coded as ‘active’ lack narrative evidence of specific policies that incentivised a drop in NPL stock. We also employ an alternative classification of episodes based entirely on the collected narrative evidence.
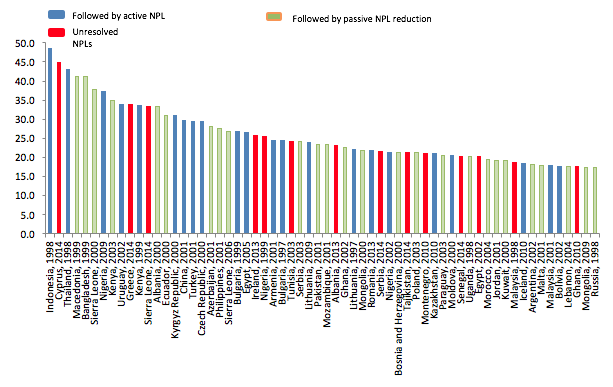
Selection into ‘active’ reduction episodes is unlikely to be completely random. In particular, actions appear to be more likely if NPL ratios are high while economies with a lower per capita income and economies with lower initial debt-to-GDP ratios are more likely to be able to ‘grow out’ of an NPL episode owing to resumption of fast credit growth. At the same time, both active and passive episodes on average start at almost identical NPL ratios, and these ratios fall to the same level, the average level for countries without an NPL problem. Indeed, the incidence of active, passive and procrastinating episodes is fairly evenly distributed across values of NPL ratio (Figure 2), alleviating concerns that the incidence and type of NPL reduction is related to the intensity of the NPL problem.
Figure 2. Cases of the highest NPL ratio, in descending order
We compare the economic impact of various types of episodes using propensity score matching to control for potential selection bias. We use two different sets of variables to control for initial differences in the structure of financial markets and general macroeconomic conditions.
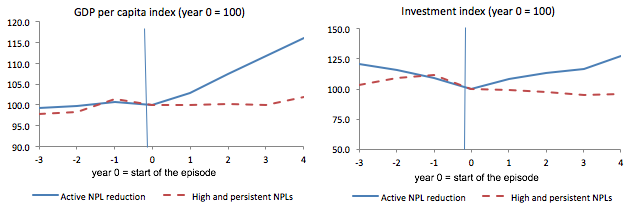
The analysis reveals that countries that reduced their NPL ratio experienced faster GDP growth and invested more than those that let NPL stagnate. We find that this effect was stronger in the passive group, but not statistically significantly so. The outcomes in the case of active episodes are significantly better than for the procrastinating group – every year the NPL problem is not addressed costs the economy in excess of two percentage points in terms of per capita GDP growth (Figure 3).
Figure 3. Results of the matching analysis (active vs. procrastinating).
In sum, the analysis shows that the episodes of NPL reductions that were driven largely by a fall in the stock of NPLs as opposed to the growth in fresh credit and that benefitted from specific policy actions are associated with significant growth dividends when compared to countries where high NPL ratios persisted over long periods.
Active policies to resolve NPLs are associated with short-term costs. They rely on sufficient capitalisation of banks allowing for full provisioning of non-performing exposures and their write-off or sale at discounted prices. Centralised solutions involving well-capitalised state-backed bad banks, asset management companies, or significant tax incentives for NPL resolution also carry a fiscal cost. Active policies also require strong administrative capacity and legal regimes supportive of NPL resolution. For these reasons, in many cases authorities lack capacity (administrative or fiscal) or willingness to deploy active policies to address NPLs. Yet systematic analysis of the past episodes of high and persistent NPLs suggests that the short-term price of active NPL resolution is well worth paying.
References
Balgova, M, M Nies and A Plekhanov (2016) “The economic impact of reducing non-performing loans”, EBRD Working Paper, 193.
Beck, T, P Jakubik and A Piloiu (2013) “Non-performing loans: What matters in addition to the economic cycle?”, European Central Bank, Working Paper 1515.
Caballero, R, T Hoshi and A Kashyap (2008) “Zombie lending and depressed restructuring in Japan”, American Economic Review, 98: 1943-1977.
Cucinelli, D (2015) “The impact of non-performing loans on bank lending behaviour: Evidence from the Italian banking sector”, Eurasian Journal of Business and Economics, 8: 59-71.
IMF (2016) Global Financial Stability Report, October.
Kaminsky, G, and C Reinhart (1999) “The twin crises: The cause of banking and balance of payment problems”, International Finance Discussion Papers 544, Board of Governors of the Federal Reserve System.
Leon, H and M Tracey (2011) “The impact of non-performing loans on loan growth”, IMF Working Paper.
Lu, W and D Whidbee (2013) “Bank structure and failure during the financial crisis”, Journal of Financial Economic Policy, 5: 281-299.
Maggi, B and M Guida (2009) “Modelling non-performing loans probability in the commercial banking system: Efficiency and effectiveness related to credit risk in Italy”, University of Rome La Sapienza Working Paper.
Nkusu, M (2011) “Non-performing loans and macrofinancial vulnerabilities in advanced economies”, IMF Working Paper 11/161.
Woo, D (2000) “Two approaches to resolving nonperforming assets during financial crisis”, IMF Working Paper 00/33.


