The debate on the adverse consequences of the economic crisis in the US flags rising unemployment as the most pressing issue. But crises are also bad for income distribution (Coile and Levine 2009). Households in which a bread-winner becomes unemployed face a significant decline in earnings. Thus rising unemployment mechanically causes the bottom of the earnings distribution to fall off relative to the median, increasing inequality in earnings.
A key question for the policy debate is to what extent this loss of earnings power at the bottom of the earnings distribution translates into a decline in living standards.
New evidence
In this column, we present some evidence on this question from the experience of the US and other countries during previous recessions. We also use recently available cross-sectional data to give a sense of the distributional changes that the current crisis has brought so far (see Heathcote, Perri, and Violante 2010 for details.)
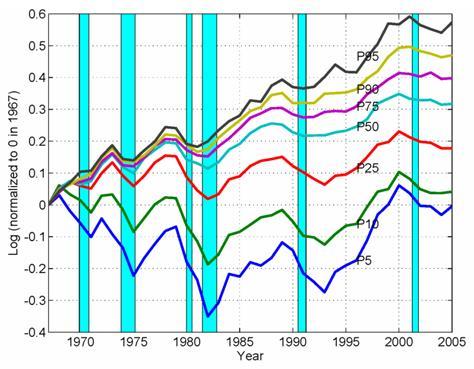
Figure 1 plots time series for various percentiles in the distribution for US household earnings, together with shaded areas denoting NBER-dated recessions.1 The figure starkly illustrates the fact that the households in the bottom percentiles of the earnings distribution suffer the largest earnings declines in recessions. Moreover, declines at the bottom of the earnings distribution can be very persistent. For example, earnings at the 10th percentile declined by 20% in the 1980-82 recession; they did not return to pre-recession levels until the late 1990s.
Figure 1. Household earning percentiles (CPS)
However, labour earnings are not the only source of income for households. In particular, at the bottom of the earnings distribution, government and private transfers such as unemployment insurance, welfare, food stamps, and pension income are counter-balancing sources of income that tend to rise when earnings fall, thereby mitigating widening earnings inequality.
In Figure 2, the solid line represents the variance of earnings (effectively summarising the information in Figure 1) while the dashed line represents the variance of total household income, which includes government and private transfers. Notice that in recessions, inequality in total income rises much less than inequality in earnings.
Figure 2. Inequality in earnings and total income (CPS)
The fact that inequality in total income is much less cyclical than inequality in labour earnings is not unique to the US economy. Patterns for earnings and income inequality during recessions are documented for a number of countries in a forthcoming special issue of the Review of Economic Dynamics.
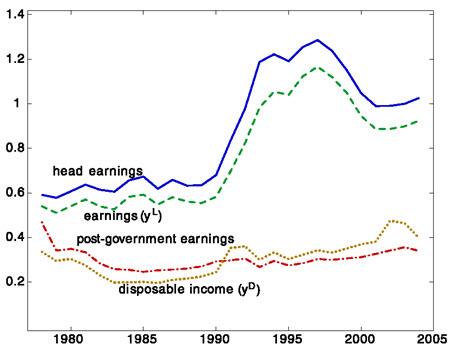
Figure 3, reproduced from that volume’s paper on Sweden (Domeij and Floden 2010), offers a dramatic illustration of the impact that public transfers can have on inequality. In 1992, Sweden experienced a severe recession that caused a dramatic increase in earnings inequality. However, inequality in total household pre-tax income and in disposable income (which includes taxes) barely moved.
Figure 3. Variance of log of various income measures in Sweden
Compared to Sweden, the government in the US plays a smaller role, and taxes and transfers only partially offset widening earnings inequality in recessions. In particular, inequality in total household income increased during the recessions of the early 1980s and early 1990s.
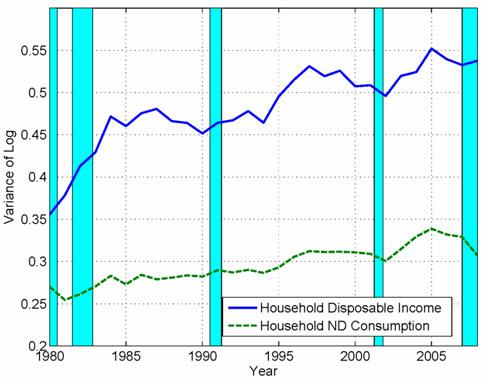
Did these increases in income inequality translate into widening inequality in welfare and living standards? Because consumption of goods and services is more closely connected to welfare, we have examined the extent to which rising income inequality during recessions translates into consumption inequality. Figure 4 plots inequality in total after-tax income against inequality in non-durable consumption.2
Figure 4. Inequality in disposable income and consumption (CEX)
The figure shows that fluctuations in consumption inequality tend to be more muted than fluctuations in income inequality. In particular, inequality in consumption rose by much less than inequality in income during the early 1980s recession. This finding is consistent with standard economic theory, which predicts that households should draw down savings or increase borrowing in order to smooth consumption in the face of non-permanent recession-driven declines in income.
The 2008-09 crisis
Although the current economic downturn is still unfolding, data for cross-sectional inequality in the US in 2008 recently became available.
The last data point in Figure 4 reports the variance of (log) disposable income and (log) non-durable consumption in 2008. The figure shows a slight increase in inequality in disposable income but a marked compression in inequality of consumption.
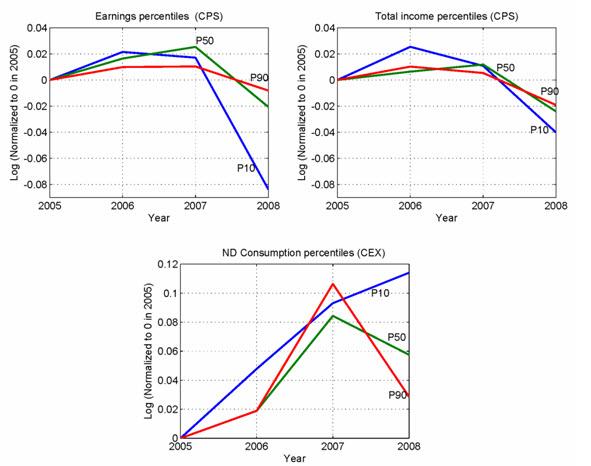
To better understand this phenomenon, we plot household earnings, total income, and consumption at the 10th percentile, median, and 90th percentiles of their respective distributions in Figure 5. Focusing on the top two panels of Figure 5, we see that earnings and total income behave in a very similar way going into the current recession as in previous recessions: earnings fall fast at the bottom, while government and private transfers imply a much smaller decline in total income.
The bottom panel of the figure, however, reveals surprising dynamics for consumption. The reason why consumption inequality declines (as shown in figure 4), is a substantial fall in spending at the top of the consumption distribution, while spending at the bottom increases.3
Figure 5. Inequality patterns in the 2008 recession (CEX and CPS)
This finding suggests that changes in the distribution of consumption (and hence welfare) during recessions are driven by more than just changes in the distribution of income.
One distinctive feature of the current recession it that it has been accompanied by a collapse in asset prices, which we conjecture has had an important effect on the distribution of consumption. A very rough characterisation could be the following:
- Households at the bottom of the consumption distribution do not own any significant assets.
- The median household owns a house;
- Households at the top own a house plus a significant amount of financial wealth.
Thus households at the top of the consumption distribution have been the worst-hit by falling housing and equity prices, while those at the bottom have been relatively unscathed. If this interpretation is correct, then declines in asset prices have had a larger effect on consumption than changes in the earnings distribution. Two caveats are in order, however. First, a full accounting of the current recession awaits data for 2009, a year in which unemployment continued to rise. Second, our measure of consumption excludes housing and cars, two sectors that have been particularly hard hit.
Conclusion
Recent evidence shows how the distribution of resources changes in recessions in complex ways.
- The bottom of the earnings distribution falls off substantially relative to the median, causing earnings inequality to increase in recessions.
- This increase is substantially mitigated by government and private transfers. This mitigating effect, together with the fact that households can use borrowing and lending to smooth income declines, causes the consumption distribution to typically move very little during recessions.
- The current recession appears somewhat unusual. So far, consumption inequality has declined sharply, perhaps because the consumption-rich have been disproportionately hurt by declining asset prices.
Disclaimer: The views expressed herein are those of the authors and not necessarily those of the Federal Reserve Bank of Minneapolis or the Federal Reserve System.
Footnotes
1 Figures 1, 2 and 4 in this article are based on figures in Heathcote, Perri, Violante (2010). Data in Figure 1 is from the Current Population Survey (CPS). Our sample includes all households that report positive earnings and contain at least one person aged 25-60. For each household, earnings are divided by the number of adult-equivalents in that household and inflation-adjusted. All percentiles are normalised to zero in 1967.
2 Figure 4 is based on a sample of working-age households drawn from the Consumer Expenditure Survey (CE). Consumption information is not available in the CPS. The measure of consumption here includes non-durables and services, and small durables like furniture and appliances. It excludes housing and cars.
3 This finding is in line with Parker and Vissing-Jorgensen (2009), which documents, before the 2008 recession, an increased comovement of the top of the consumption distribution with aggregate fluctuations.
References
Coile, Courtney C. and Phillip B. Levine (2009), “Will the current economic crisis lead to more retirements?”, VoxEU.org, 31 October
Domeij, D. and M. Floden, (2010), “Inequality trends in Sweden 1978-2004”, Review of Economic Dynamics, forthcoming.
Heathcote J. , F. Perri and G. Violante, (2010), “Unequal We Stand: An Empirical Analysis of Economic Inequality in the US, 1967-2006”, Review of Economic Dynamics, forthcoming.
Parker J. and A. Vissing-Jorgensen (2009), “Who Bears Aggregate Fluctuations and How?”, American Economic Review, 99(2), 399-405


