Since the outbreak was first reported in Wuhan, China in late-December 2019, COVID-19 has spread to over 200 countries and territories globally. In the absence of a vaccine or effective treatment, governments worldwide have responded by implementing unprecedented containment and mitigation measures (the ‘Great Lockdown’). This in turn has resulted in large short-term economic losses and a decline in global economic activity not seen since the Great Depression (Baldwin and Weder di Mauro 2020, Baker et al. 2020).
To date, it remains unclear the extent to which these unprecedented measures have been successful and what would have been the number of cases and fatalities in the absence of these interventions. Indeed, despite significant theoretical contributions on the topic (Eichenbaum et al. 2020, Forslid and Herzing 2020, Brotherhood et al. 2020), to the best of our knowledge, the quantitative effect of these measures has not yet been examined, beyond China (e.g. Chinazzi et al. 2020, Tian et al. 2020, Cowling et al. 2020). Our recent paper (Deb et al. 2020) addresses this gap by using daily data on the number of COVID-19 cases and deaths as well as on real-time containment measures (Hale et al. 2020) implemented by 129 countries around the world.
The effect of containment measures on COVID-19 cases and death
We follow the approach proposed by Jordà (2005) to estimate the dynamic cumulative effect of containment measures on the number of confirmed COVID-19 cases and deaths, a methodology also used by Auerbach and Gorodnichenko (2013), Ramey and Zubairy (2018), and Alesina et al. (2019) among others. Establishing the causal effect of containment measures on the number of confirmed infections and death is difficult because countries have introduced the measures in response to the spread of the virus. We address this reverse-causality issue by controlling in the analysis for the change in the number of infected cases or deaths occurring in the day before the implementation of containment measures. Given lags in the implementation of interventions at daily frequency, this allows us to effectively control for the endogenous response of containment measures to the spread of the virus. The analysis also controls for unobserved country-specific characteristics and – to further account for expectations about the country-specific evolution of the pandemic – for country-specific linear, quadratic, and cubic time trends.
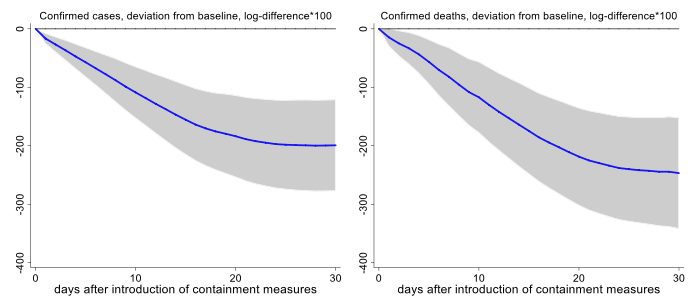
Our results suggest that containment measures, by reducing mobility, have been very effective in flattening the ‘pandemic curve’ (Figure 1). For example, the stringent containment measures put in place in New Zealand – restrictions on gatherings and public events implemented when cases were in single digits, followed by school and workplace closings as well as stay-at-home orders just a few days later – are likely to have reduced the number of fatalities by over 90% relative to a baseline with no containment measures. In other words, the results suggest that, in a country like New Zealand, the number of confirmed COVID-19 deaths would have been at least ten times larger than in the absence of stringent containment measures.
Figure 1 Effect of containment measures on total COVID-19 cases and deaths
Note: Impulse response functions are estimated using a sample of 129 countries using daily data from the start of the outbreak. The analysis is restricted to countries with a significant outbreak that has lasted at least 30 days. The graph shows the response and confidence bands at 95 percent to an index capturing the stringency of containment and mitigation measures. The horizontal axis shows the response x days after the introduction of containment measures. The regressions include time varying control variables and country specific linear, quadratic and cubic time trend. Results are based on May 11 data. The figure displays log-difference changes whereas the text translates these into percent changes. See Deb et al. (2020) for details.
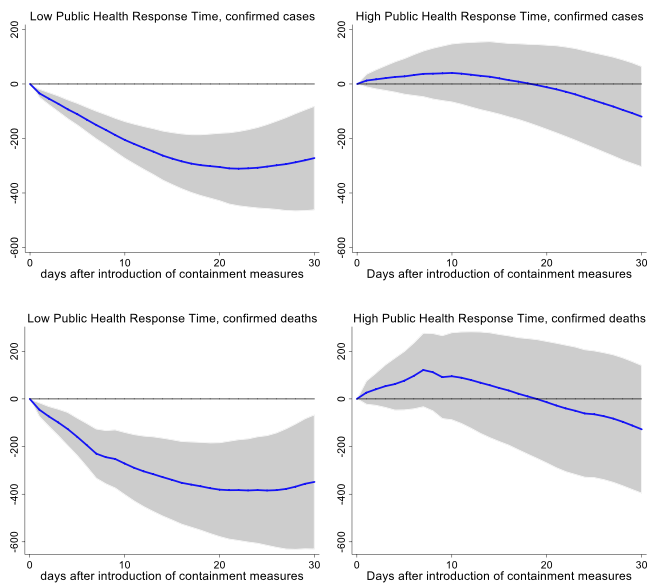
Early intervention and containment, measured as the number of days it took a country to implement containment measures after a significant outbreak (public health response time, or PHRT, in epidemiology jargon), played a significant role in flattening the curve. Countries such as Vietnam that put in place containment measures faster witnessed a reduction in the average number of infections and deaths of 95% and 98%, respectively (Figure 2). This in turn is likely to have laid the foundation for a resumption of growth in the medium term (see Barro et al. 2020).
Figure 2 Interaction with public health response time
(deviation from baseline, log-difference*100)
Note: Impulse response functions are estimated using a sample of 129 countries using daily data from the start of the outbreak. The analysis is restricted to countries with a significant outbreak that has lasted at least 30 days. The graph shows the response and confidence bands at 95 percent to an index capturing the stringency of containment and mitigation measures, interacted with public health response time. The horizontal axis shows the response x days after the introduction of containment measures. The regressions include time varying control variables and country specific linear, quadratic and cubic time trend. Results are based on May 11 data. The figure displays log-difference changes whereas the text translates these into percent changes. See Deb et al. (2020) for details.
Role of country characteristics and health infrastructure
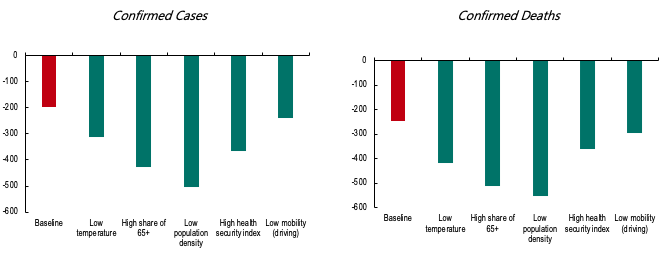
Figure 3 shows that the effect of containment measures also varied by country and social characteristics. The impacts were stronger in countries where the average temperature during the outbreak was lower and where the share of elderly in the population is larger, reflecting higher infection rates in colder weather and the vulnerability of the populace. On the other hand, having a strong health system and lower population density made containment and mitigation strategies easier to implement and enforce. How civil society responded to de jure restrictions mattered as well – countries where lockdown measures resulted in less mobility, i.e. de facto more social distancing – saw a greater reduction in the number of COVID-19 infections and deaths.
Figure 3 Interaction with country characteristics
(deviation from baseline 30 days after introduction of containment measures, log-difference*100)
Note: Impulse response functions are estimated using a sample of 129 countries using daily data from the start of the outbreak. The analysis is restricted to countries with a significant outbreak that has lasted at least 30 days. The graph shows the cumulative response after 30 days for the baseline and each county characteristic. The horizontal axis shows the response x days after the introduction of containment measures. The regressions include time varying control variables and country specific linear, quadratic and cubic time trend. Results are based on May 11 data. The figure displays log-difference changes whereas the text translates these into percent changes. See Deb et al. (2020) for details.
Types of containment measures
Finally, we explored whether the effect of containment varies across types of measure. Many of these measures were introduced simultaneously as part of the country’s response to limit the spread of the virus, making it challenging to identify the most effective measure. Nevertheless, our results suggest that, while all measures have contributed to significantly reduce the number of COVID-19 cases and deaths, stay-at-home orders appear to have been relatively more effective.
Our empirical estimates provide a reasonable assessment of the causal effect of containment policies on infections and deaths, giving us comfort that the Great Lockdown, despite its enormous short-term economic costs, has saved hundreds of thousands of lives.
Authors’ note: The views expressed in this column should not be ascribed to the institutions with which the authors are affiliated.
References
Alesina, A F, D Furceri, J D Ostry, C Papageorgiou and D P Quinn (2019), “Structural Reforms and Elections: Evidence from a World-Wide New Dataset”, NBER Working Paper No. w26720).
Auerbach, A J and Y Gorodnichenko (2013), “Output spillovers from fiscal policy”, American Economic Review 103(3): 141-46.
Baldwin, R and B Weder di Mauro (2020), Mitigating the COVID Economic Crisis: Act Fast and Do Whatever It Takes, a VoxEU.org eBook, CEPR Press.
Baker, S, N Bloom, S Davis and S Terry (2020), “COVID-induced economic uncertainty and its consequences”, VoxEU.org, 13 April.
Barro, R J, J F Ursúa and J Weng (2020), "The Coronavirus and the Great Influenza Pandemic. Lessons from the “Spanish Flu” for the Coronavirus’s Potential Effects on Mortality and Economic Activity", NBER working paper 26866.
Brotherhood L, P Kircher, C Santos and M Tertilt (2020), “An economic model of the COVID-19 epidemic: the importance of testing and age-specific policies”, CEPR Discussion Paper DP14695.
Chinazzi et al. (2020), “The effect of travel restrictions on the spread of the 2019 novel coronavirus (COVID-19) outbreak”, Science 368: 395-400.
Cowling et al. (2020), “Impact assessment of non-pharmaceutical interventions against coronavirus disease 2019 and influenza in Hong Kong: an observational study”, Lancet Public Health 2020(5): e279–88.
Deb, P, D Furceri, J Ostry and N Tawk (2020), “The Effects of Containment Measures on the COVID-19 Pandemic”, Covid Economics: Vetted and Real-Time Papers 19: 53-86.
Eichenbaum M, S Rebelo and M Trabandt (2020), “The Macroeconomics of Epidemics”, NBER Working Papers 26882.
Forslid R and M Herzing (2020), “Assessing the consequences of quarantines during a pandemic”, CEPR Discussion Paper DP14699.
Granger, C W J and T Teräsvirta (1993), Modelling Nonlinear Economic Relationships, Oxford University Press.
Hale, T, S Webster, A Petherick, T Phillips and B Kira (2020), “Oxford COVID-19 Government Response Tracker”, Blavatnik School of Government.
Jordà, Ò (2005), “Estimation and inference of impulse responses by local projections”, American Economic Review 95(1): 161-182.
Tian H. et al. (2020), “An investigation of transmission control measures during the first 50 days of the COVID-19 epidemic in China”, Science 10.1126/science.abb6105 (2020).
Ramey, V A and S Zubairy (2018), “Government spending multipliers in good times and in bad: evidence from US historical data”, Journal of Political Economy 126(2): 850-901.


