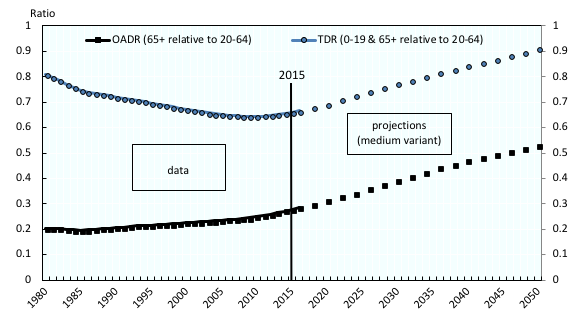
Population ageing is a fast-accelerating, long-term trend. We can show this using the old-age dependency ratio – a demographic indicator that measures the size of non-working age groups of the population relative to that of people of working age.1 Figure 1 shows averages for OECD countries. In 1980, there were 20 people aged 65 or older for every 100 people of working age (that is, aged between 20 and 64). By 2015, this number had increased by 40%, to 28 people aged 65 or over for every 100 of working age. Project forward another 35 years, the ratio will be 53 to 100 in 2050 based on UN mortality projections (United Nations 2017) – a further increase of 90%. This is because we are living longer and having fewer children.
Figure 1 also shows past trends in the total dependency ratio – the demographic indicator which is more relevant to capture the influence of demographics on GDP per capita, because it includes individuals younger than the working age. It is defined as the number of people younger than 20, or 65 and older, for every 100 people of working age.
Figure 1 Old-age dependency ratio (OADR) and total dependency ratio (TDR)
Notes: Based on working age defined as the 20-64 age group. Unweighted OECD country averages, projections after 2015.
Source: Authors’ calculation based on United Nations (2017).
Despite the substantial increase in old-age dependency ratios, the average total dependency ratio in the OECD dropped from 0.80 in 1980 to about 0.65 in 2015. The key driver was the steep decline in fertility until the late 1990s, which led to a sharp reduction in the relative number of young people. This was about 60 for every 100 people of working age in 1980, but fewer than 40 in 2015. This more than offset the impact of ageing on the relative size of the workforce and made it easier to finance the expansion of tertiary education.
The number of young people for every 100 people of working age will remain stable at about 40 in the upcoming decades, however, unless fertility changes markedly. This means that the total dependency ratio will increase drastically. It is expected to exceed 0.90 by 2050, compared to 0.65 in 2015. If employment rates, especially at older ages, do not rise, these demographic developments will ceteris paribus (in particular, we are ignoring potential rises in productivity) be a substantial drag on standards of living.
The limits of pension policies
This has triggered many policy reforms to help countries adapt their economies, especially pension policies to increase the age of retirement. We should ask whether this alone will be sufficient to avoid a future lack of labour in OECD and EU economies. By how many years would the upper age boundary of working life – using 65 as a reference – have to increase to keep dependency ratios constant over time?
We computed the shift in the age boundary between 1980 and 2015 which would have maintained old-age dependency ratios at their 1980 levels, starting from age 65 in 1980.2 On average in the OECD, this was 3.4 years, or an upper age boundary of 68.4 years, by 2015. Over the same period, life expectancy at age 65 grew by 4.4 years. A rise of the retirement age of about three-quarters of the number of years we could expect to live at age 65 would therefore have been sufficient to avoid an increase in the OADR. By contrast, the average total dependency ratio would have stabilised at its 1980 level by loweringthe age boundary by 4.5 years, from 65 in 1980 to 60.5 in 2015.
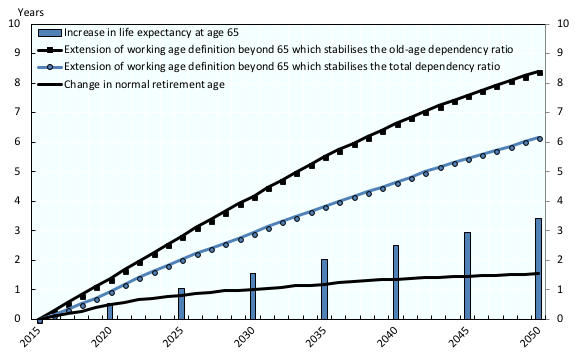
In the OECD, this all changes in the next 35 years (Figure 2). Life expectancy at age 65 is expected to grow at a slightly slower pace than in the past, with gains being reduced to 3.4 years. Stabilising the old-age dependency ratio would mean an average shift in the age boundary between 2015 and 2050 by a stunning 8.4 years. The stable number of young people relative to those of working age acts as an offsetting factor, resulting in a lower, but still large, increase of 6.2 years in the age threshold that keeps the total dependency ratio constant.
To put things in perspective, measures already legislated in OECD countries imply an average increase in the normal retirement age of 1.5 years by 2050.3 The rise in the statutory retirement ages falls short of what would be needed to prevent higher dependency ratios by a wide margin.
Figure 2 Average extension of working age definition beyond 65 that would stabilise dependency ratios between 2015 and 2050, and average changes in the normal retirement age and life expectancy at 65
Notes: Unweighted OECD country averages, 2015-2050, base year 2015. The normal retirement age is defined as the age at which a full-career worker entering the labour market at age 20 can receive a full pension, averaged across genders.
Source: Authors’ calculation based on United Nations (2017).
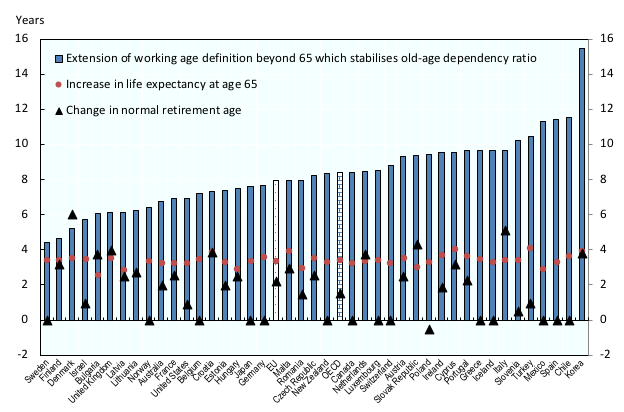
The shift in demographic structures varies across countries. This means the increase in the age threshold which would stabilise the old-age dependency ratio varies too, as shown in Figure 3. In Finland and Sweden it would be about 4.5 years. In Chile, Mexico and Spain, the figure would be 11.5 years – though from a relatively low level in the two Latin American countries. In South Korea, due to the very fast pace of ageing, the change required would be 15.5 years.4 Denmark would be the only country where the legislated retirement-age increase, given the introduced automatic link between legal retirement ages and life expectancy, exceeds what is required to stabilise the OADR.5
Figure 3 Extensions of working age definition beyond 65 that would stabilise old-age dependency ratios, compared to changes in the normal retirement age and life expectancy at 65 (2015-2050)
Notes: Base year 2015. The normal retirement age (NRA) is defined as the age at which a full-career worker entering the labour market at age 20 can receive a full pension.
Source: Authors’ calculation based on United Nations (2017).
Pressure on pension systems remains high
Policymakers who want to preserve retirement income adequacy will be under financial pressure. The effective old-age support ratio (number of employed people relative to the number of retirees) is the inverse of the effective old-age dependency ratio. It combines demographics and employment rates across age groups, and so is a useful indicator to illustrate what is at stake.
In a financially balanced pay-as-you-go pension system, a decrease of 1% in the effective old-age support ratio would lead to a fall of 1% in the average pension relative to the average wage, or would require an increase of 1% in the contribution rate.6 This is a mathematical identity, so there is no escape. Avoiding a fall in relative pension levels when the population ages can thus only be achieved by:
- higher contribution rates,
- higher employment, perhaps through later retirement or more female employment, or
- a financial deficit in pension accounts that would eventually need to be covered by taxation.
Within defined contribution schemes, the pension replacement rate for a given career is proportional to the contribution rate, and mainly determined by the rates of return on accumulated assets. These rates of return ultimately depend on the productive capacity of the economies in which those assets, either financial or notional, are invested. Whatever the structure of pension systems, any labour scarcity induced by population ageing is likely to reduce pension benefit levels.
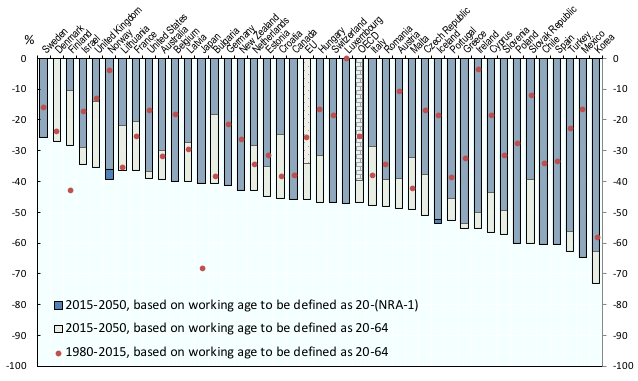
In past 35 years, the (purely demographic) old-age support ratio, dropped by slightly more than 25% on average in the OECD (Figure 4). This has generated financial imbalances and higher pension spending, which triggered an increase in contribution rates. The share of public pension spending in GDP increased on average by more than 40% since 1990, and has been larger than 8 percentage points since 2013 (OECD 2017).
Projections, including those made by the European Commission, shows the challenge OECD countries are facing in terms of the decrease in replacement rates driven by the already legislated reforms, including through automatic adjustment mechanisms. For example, imagine an average-wage individual working uninterrupted for 40 years until the standard pensionable age, retiring in 2056 compared to 2016. On average, in the EU, this retiree faces a 10% drop in replacement rates (European Commission 2018). The demographic old-age support ratio, however, will fall by almost 50% over a similar time period, as shown in Figure 4, slightly reduced to about 40% when accounting for legislated changes in retirement ages, and assuming a one-to-one transmission into effective retirement ages. Note there is less scope to raise pension contribution rates or taxes used to finance pensions in many countries.
The inevitable conclusion is that, if employment rates do not increase substantially, there will be strong pressure on retirement income. Enhancing employment – especially at older ages – and productivity will therefore be critical in ageing societies if we want to preserve the level of pensions.
Figure 4 Change in the old-age support ratio in 2015-2050 compared to 1980-2015
Notes: On average among OECD countries, the old-age support ratio is projected to fall by 47% between 2015 and 2050, while between 1980 and 2015 it already dropped by 25%. When computing the support ratio based on normal retirement ages according to legislated rules instead of age 65, the projected drop is reduced from 47% to 40%. In countries such as Sweden, there is currently no legislated change in the NRA, which is equal to 65 from 2015 onwards.
Source: Authors’ calculation based on United Nations (2017).
Authors’ note: The opinions and arguments expressed here are those of the authors and do not necessarily reflect the views of the OECD nor of its member countries.
References
European Commission (2018), The 2018 Pension Adequacy Report: current and future income adequacy in old age in the EU, Publication Office of the European Union.
OECD (2017), Pensions at a Glance 2017: OECD and G20 Indicators, OECD Publishing.
United Nations (2017), World Population Prospects: The 2017 Revision.
Endnotes
[1] Note that population ratios do not show the full picture, for example because they ignore employmentrates, which differ along the life cycle and across generations.
[2] Concretely, we calculated the age X that ensures that the number of individuals aged X or older, relative to those aged between 20 and X-1 in 2015, is equal to the old-age dependency ratio based on age 65 in 1980. The choice of 65 as the initial age boundary has a limited impact on the estimated increase to stabilise dependency ratios.
[3] We use the definition in OECD (2017): the normal retirement age is the age at which a full-career worker entering the labour market at age 20 can receive a full pension, without penalties.
[4] The age threshold which keeps the TDR constant in countries differs similarly, but in this case Mexico, Israel and Turkey are exceptions. They would need a much smaller increase to stabilise the TDR than to stabilise the OADR, because fertility is expected to fall further in those countries, reducing the number of children.
[5] Life expectancy at 65 used to project the normal retirement age based on data provided by countries in OECD (2017), which might differ from UN projections.
[6] The budget constraint of a financially balanced pay-as-you-go pension system requires that total pensions paid equal total contributions received, which can be expressed as p • R = c • w • E, where p is the average pension, w is the average wage (among contributors), c is the average effective pension contribution rate (taking into account contribution floors and ceilings), R is the number of pensioners (“retirees”), and E is the number of contributors (“employed people”). This implies that:
That is, the average pension relative to the average wage is equal to the effective old-age support ratio E/R which combines the pure demographic information captured by the old-age dependency ratio with employment rate patterns across age groups – times the effective contribution rate.


