The COVID-19 virus took just two months to spread from China to the rest of the world. In the process, governments resorted to containment and closure policies to limit social contact in order to prevent an overload of health systems. The shutdowns wreaked havoc on domestic and external demand across world. With the risk-off market environment, money invested in emerging markets (EMs) ran for the exits, credit default swaps (CDS) spreads widened, and exchange rates depreciated. In their VoxEU column of 21 April 2020, Hevia and Neumeyer warned of a ‘perfect storm’ as the coronavirus was about to hit emerging markets. In response, EM sovereigns acted decisively and tried to alleviate the economic hardships through fiscal and monetary stimuli. In Daehler et al. (2020), we study daily CDS data from January to June 2020 to analyse sovereign CDS spread patterns. We thereby compare the impact of market factors on CDS spreads of EM sovereigns to the impact of COVID-19 dynamics.
We first run a factor model using data from January 2014 to June 2019. Our outcome variable is the daily change in the (log) CDS spread of 30 investible EM sovereigns. We control for two key factors:1 a global factor (capturing the common component of daily sovereign risk fluctuations at the global level) and a regional factor (capturing common changes at the regional level).2 Importantly, we capture for each country a country-specific systematic exposure (called beta) to aggregate global and regional risk, respectively.
Figure 1 plots public debt/GDP ratios of emerging markets against their exposure, the betas. The debt/global-factor association is negative though relatively weak, whereas the debt/regional-factor association is negative and significant (at the 10% level) across emerging markets. We also note that countries with large negative global betas tend to have big positive regional betas. With the exception of Argentina, several of these countries are large emerging markets – i.e. Brazil, Mexico, Russia, South Africa, and Turkey.
Figure 1 Public debt/GDP and the global and regional betas of sovereign CDS spreads
Note: Public debt is measured as the 2014-2018 average. Betas are estimated using the pre-COVID-19 sample, January 2014 to June 2019.
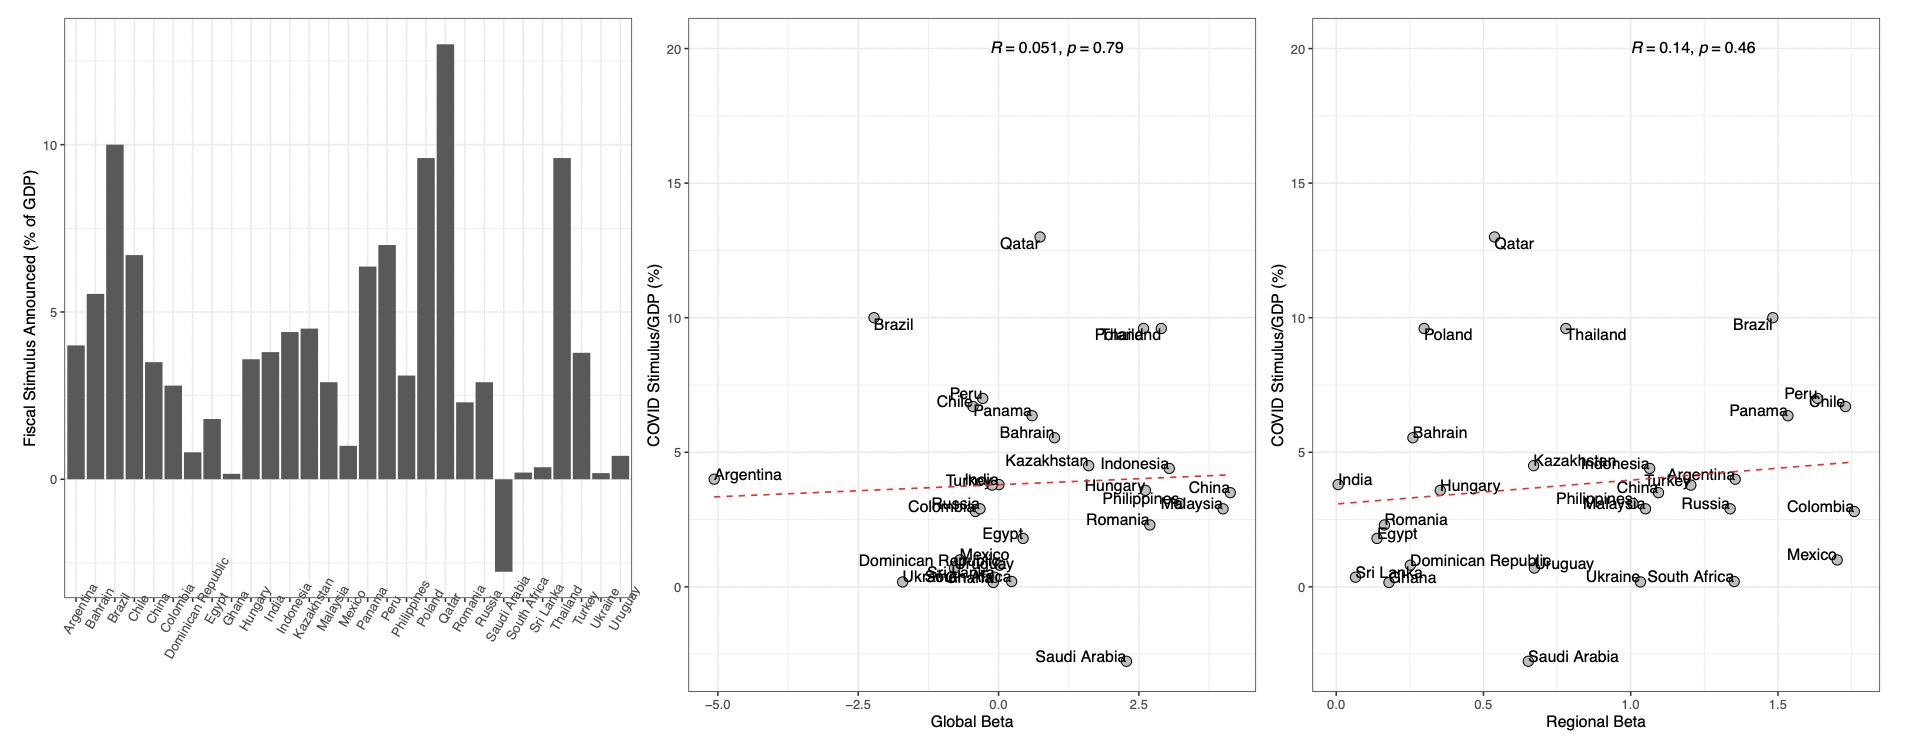
Figure 2 COVID-19-related fiscal stimulus announced in 2020 and the global and regional betas
Note: COVID-19 fiscal stimulus data taken from the IMF COVID-19 policy tracker. Betas estimated using the pre-COVID-19 sample, January 2014 to June 2019.
Figure 2 shows the association between fiscal stimulus announced in 2020 and country betas. Both regional and global betas are positively associated with fiscal stimulus size across EMs although relatively weakly. If Saudi Arabia is omitted, the coefficients become statistically significant. However, as the coefficients are mostly insignificant, it might still be the case that systematically riskier countries (higher betas) issued less stimulus/GDP because of limited fiscal space.
After estimating the factor model, we proceed to extrapolate changes in spreads (given realized values of the factors and lagged log CDS changes) from July 2019 to June 2020. This approach has two advantages. First, it allows us to judge the ‘out-of-sample’ accuracy of the model in the period before COVID-19. Second, we can calculate the ‘COVID-19 residual’, where the residual is the difference between the realised CDS adjustment against the change implied by the factor model in the first stage of the analysis.
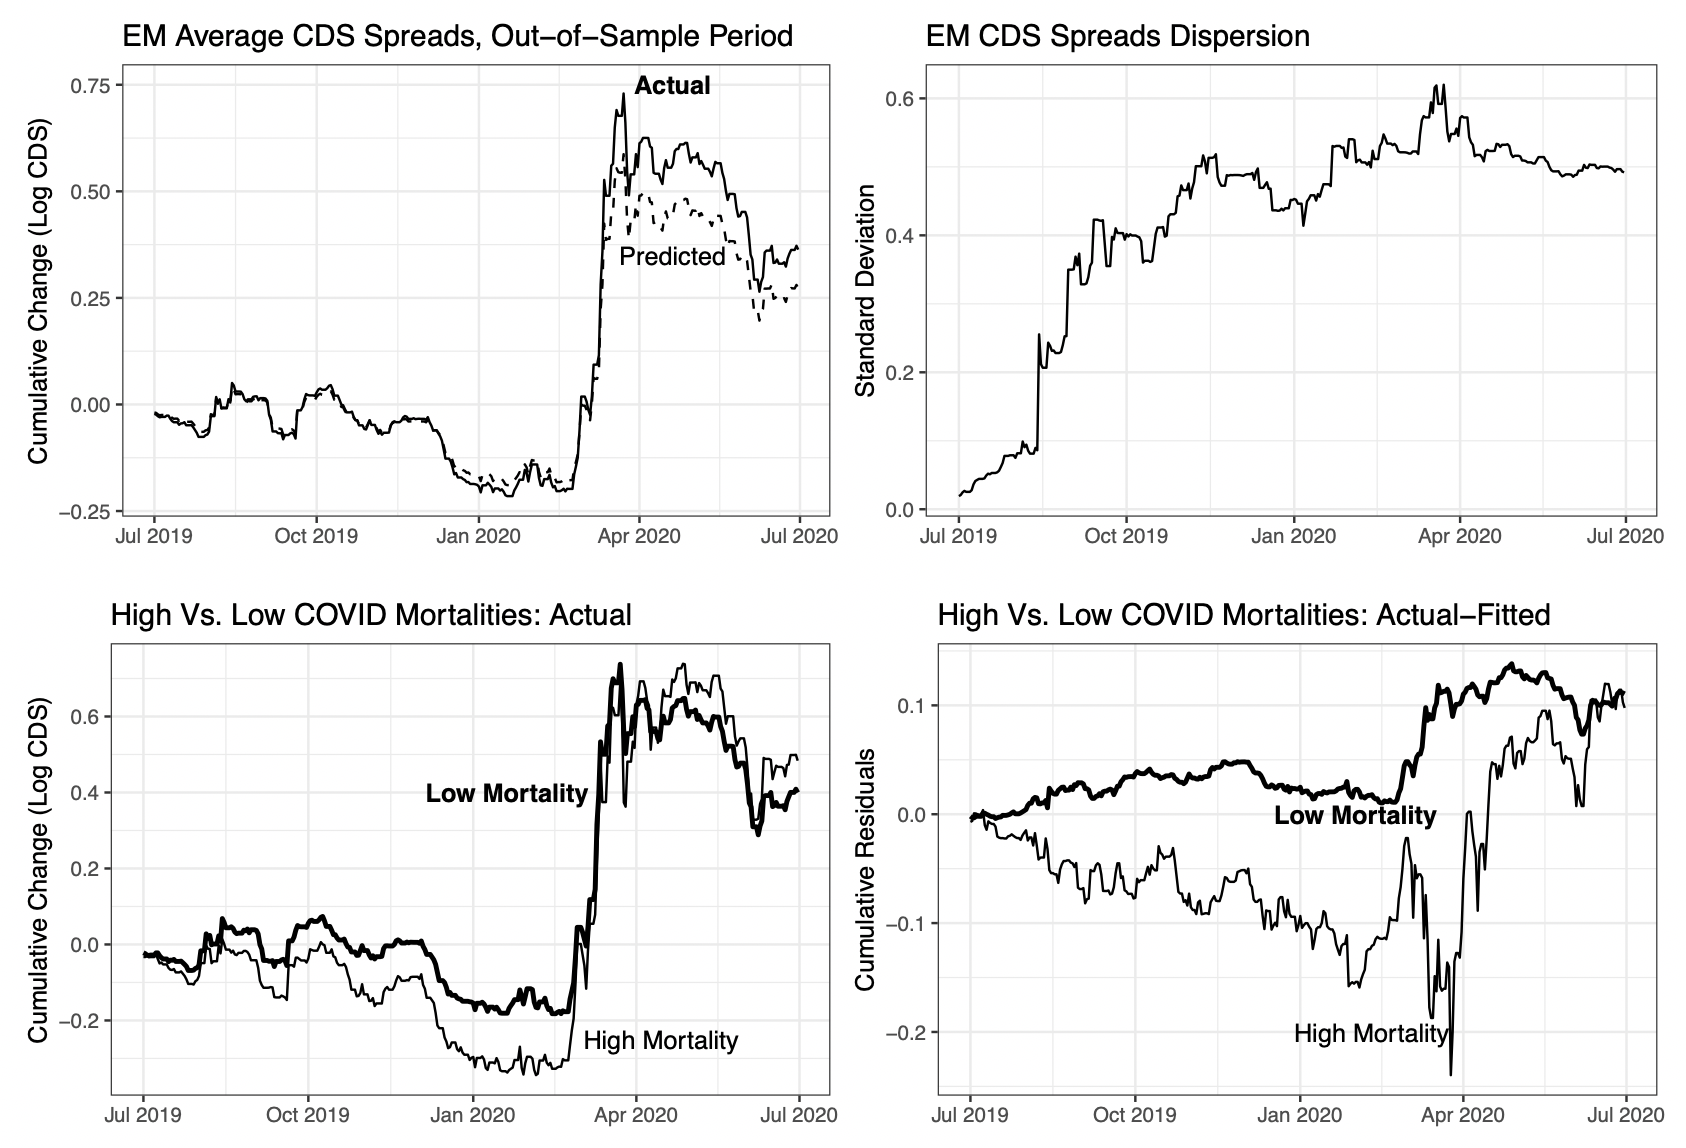
The upper-left panel of Figure 3 traces the actual EM-average cumulative (log) CDS spread changes over the COVID-19 period (solid) against those implied by the factor model (dashed). First, note that the factor model is doing a good job in predicting CDS spread changes until the end of 2019. However, starting in 2020, the actual and the predicted series begin to diverge. The gap between the actual and the predicted only starts to decrease again in March 2020 when governments and central banks worldwide announced economic stimulus packages. The upper-right panel shows the cross-sectional dispersion of CDS spreads over the same period. While the dispersion increased during the second half of 2019, it surged in March 2020, highlighting the emergence of country-specific exposure. The lower panels compare the five countries with the highest mortality rates to the five countries with the lowest mortality rates as of April. The bottom-left panel suggests that the change in actual CDS spreads was similar for high mortality and low mortality countries. Nonetheless, the bottom-right panel indicates that the high mortality countries initially experienced more swings in their CDS spreads, but the gap between the actual and the predicted became similar to that of the low mortality countries by July.
Figure 3 EM sovereign CDS spreads July 2019 to June 2020
Note: The dashed line in the upper-left figure shows the model's predicted values. The lower-right figure reflects the cumulative sovereign spread COVID-19 residual, using January 2014 to June 2019 data.
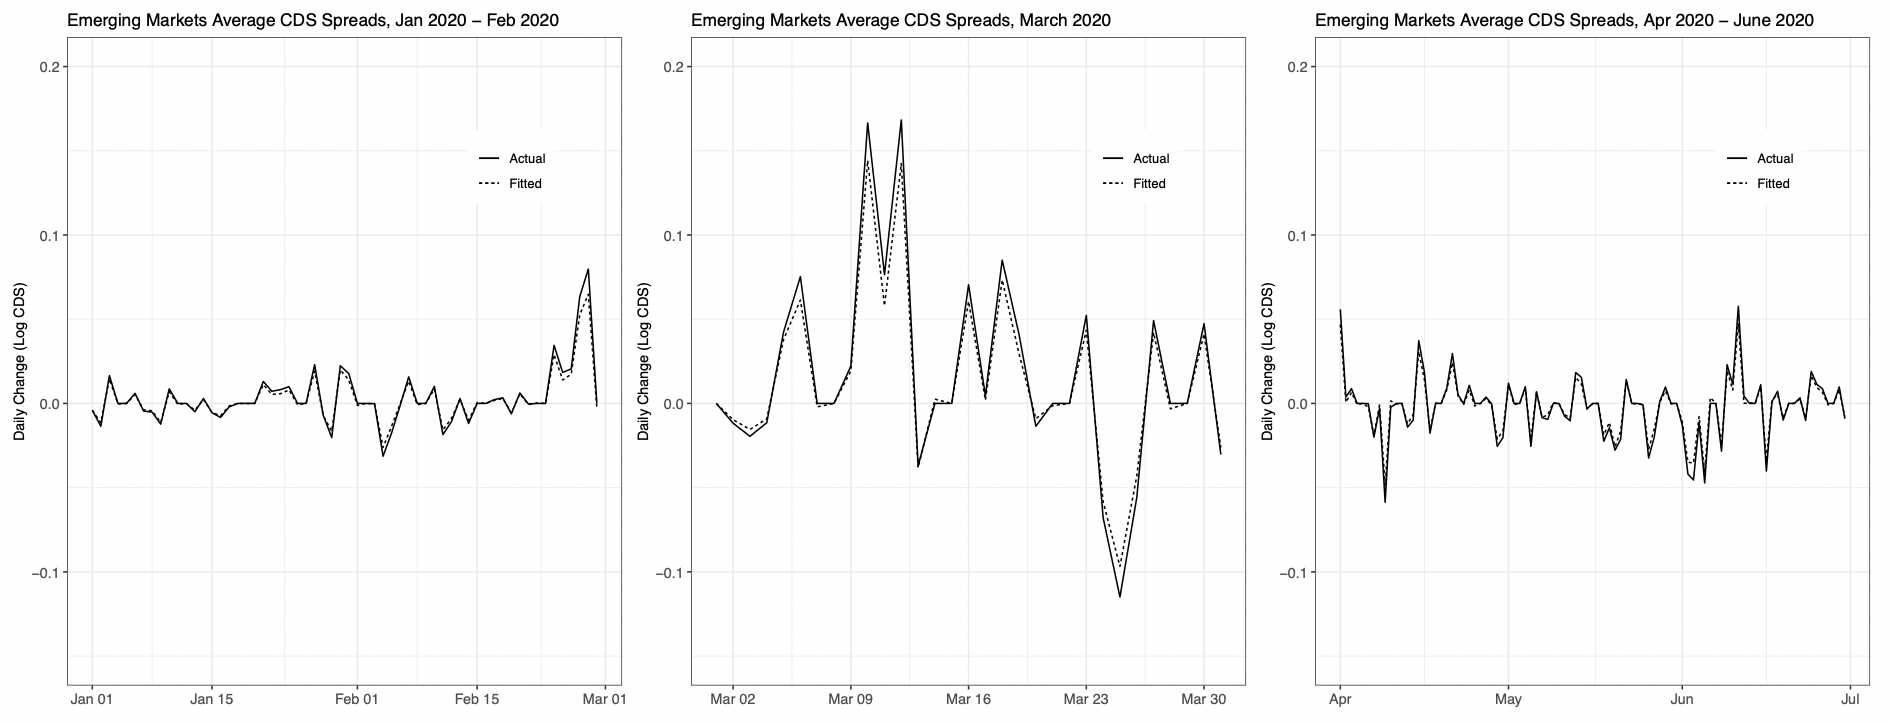
In the second part of our research, we distinguish three separate subperiods between January through July: early (January-February), peak (March), and late (April onwards). We find that the actual CDS changes diverge the most from the model-predicted values in the peak period. Further, also the spread changes were most significant during the COVID-19 peak (Figure 4). We then estimate a panel model to study the relationship between the COVID-19 residual and a set of controls, including pandemic-related variables,3 economic fundamentals,4 and policy measures.5,6
Figure 4 EM average COVID-19 residual
Note: COVID-19 residual: the difference between the actual CDS adjustment and the change implied by the model, at both the individual country and aggregate EM levels over the pandemic period. Realized (solid) and fitted (dashed, factor model estimated on 2014-2019) daily EM average CDS changes, separated by pandemic subperiods.
We find that COVID-19 new mortality and new mortality growth rates are positively associated with COVID-19 CDS residuals in all specifications. While the mortality and mortality growth rates together only explain a small share of the variation in residuals (R-squared of 1.24%), adding the other COVID-19-related variables (mobility index and growth of policy stringency index) increases the explanatory power to 5.3% and further to 19.2% with the inclusion of policy responses and economic fundamentals. While the non-pharmaceutical COVID-19 intervention's stringency is statistically insignificant, the mobility data accounts for much of the variation in COVID-19 residuals. Additional variables that stand out in accounting for the COVID-19 CDS residuals include the revenues from oil exports, fiscal space, the ECB policy, and Federal Reserve policy interventions. While COVID-19 has undoubtedly caused a lot of economic damage, the patterns of sovereign CDS spreads before and during the COVID-19 period suggest that economic fundamentals remain informative in explaining the time-varying dynamics of the sovereign credit risk exposure for emerging markets.
References
Daehler T, J Aizenman J and Y Jinjarak (2020), “Emerging Markets Sovereign Spreads and Country-Specific Fundamentals During COVID-19”, NBER Working Paper No. 27903 October.
Hevia, C, P A Neumeyer (2020), “A perfect storm: COVID-19 in emerging economies”, VoxEU.org, 21 April.
Endnotes
1 Low-frequency observables often included in the literature (e.g. measures of fiscal space) cannot be effectively incorporated into our model without introducing considerable challenges for estimation because we depend on daily CDS data for our analysis of emerging markets.
2 The common factor is modelled as the GDP-weighted average of daily changes in the log 5-year CDS spread of the US, Japan and the Eurozone and the regional factor as the GDP-weighted average of CDS spreads of a countries regional EM peers.
3 Pandemic-specific variables are: mortality outcomes, in which we include daily new mortality rate (per 1,000,000 population), daily new mortality growth rate, total mortality rate (per 1,000,000 population), and total mortality growth rate, the daily mobility measure in terms of driving (reported by Apple), and the daily growth rates of policy stringency indices (SI, constructed by OxCGRT). Lower mobility levels or stricter government non-pharmaceutical interventions may signal greater economic contraction, which may increase the debt financing burden and thus impact debt pricing during the pandemic.
4 Economic variables are: the oil price income effect, sovereign wealth fund buffers, external debt/GDP ratios and GDP ratios of debt owed to China.
5 We include dummy variables indicating the date of country-specific key fiscal policy announcements, the date of ECB’s key policy announcements, and the date of the FED’s monetary policy announcements. In order to capture key policy announcements, we aggregated a set of variables from numerous datasets for a set of key fiscal, monetary, and miscellaneous policies, across individual countries, the ECB, and the Federal Reserve. These variables captured whether or not an action or proposal was made by a given nation/institution on a specific date in the sample. Thus, we do not control for the size or number of policies on any given day, and only if the date corresponds to the announcement of at least one key policy. With the exception of the Federal Reserve (whose major announcements related to reductions in the interest rate along with fiscal spending), we restricted our analysis of key fiscal policies to those which provided millions or billions of local currency units in spending. The primary data sources used to construct these policy announcement variables are listed here: Yale COVID-19 Financial Response Tracker; Harvard Global Policy Tracker; IMF Policy Responses to COVID-19; St. Louis Federal Reserve; and the European Parliament.
6 To show that our results are not driven by factors that are time-invariant in our sample, we control for country- and time-fixed effects.


