At the time of independence in 1957, Malaysia’s colonial legacy had left high inequality, and the inequality had a marked ethnic/racial dimension. The poorest of the major ethnic groups were the Bumiputera (mostly Malay ethnicity), who were also the majority. The other main ethnic groups are those with Chinese and Indian origins (though almost all born in Malaysia). While economic growth was given a high priority post-independence, ethnic inequality appears to have been somewhat neglected as a policy issue until around 1970. Ethnic riots had broken out in Kuala Lumpur on 13 May 1969, with estimates of 600 deaths. The riots prompted a state of emergency, the suspension of Parliament for two years, and the prime minister’s resignation.
A new national effort at reducing ethnic inequality was announced in 1970 – dubbed the New Economic Policy (NEP). Its twin aims were to promote national unity and to reduce poverty, and addressing the county’s stark ethnic inequalities was seen as crucial to achieving both. The Bumiputera were to receive favourable treatment in access to education, housing, public-sector hiring, and corporate share ownership. The official NEP started in 1971 and lasted 20 years.
There has been much debate about the role that such policy efforts to reduce ethnic inequality have played in Malaysia’s economic success, including in the country’s progress against poverty. The official poverty rate has gone from about 50% in 1970 to virtually zero today. One hears claims that “[t]he most remarkable achievement of the NEP was in the reduction in poverty” (Khalid 2014). But is that right? It is easy to imagine a theoretical scenario in which the gains for the poorer ethnic group are largely captured by the non-poor within that group, while the poorest in the donor group lose out. Some critics of the NEP argued that this was indeed the case, and that ethnic redistribution came at a cost to overall economic growth and (hence) poverty reduction (e.g. Thillainathan and Cheong 2016).
A seemingly widespread view today is that, as a result of such policies, “the gap in income between Malays … and Chinese- and Indian-Malaysians has narrowed dramatically” (Economist 2017). It is true that the Bumiputera have seen higher growth rates in mean incomes than other ethnic groups since 1969, although one must also take account of the changes in the ethnic composition of the population to properly measure ethnic inequality. Nor does a higher growth rate for the poorer ethnic group imply that “the gap … has narrowed”. If the initial inequality is high enough, relative inequality can fall while absolute inequality rises. Nonetheless, a number of observers have argued that, while the past race-based policies once had a role, they have run their course, and need to be replaced with ‘needs-based affirmative action’.
The question is begging: Did ethnic inequality fall after 1969 and was that a key factor in the country’s success in reducing poverty and in managing inequality? We now have data from 18 reasonably comparable household surveys to draw on in addressing that question, although the historical tabulations are rather limited and the micro data are not publicly available. In a new paper I have tried to answer this question, to the extent this is feasible with the available data (Ravallion 2019).
A closer look at Malaysia’s progress against inequality
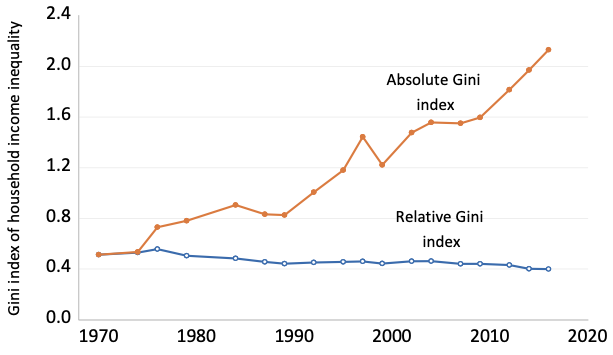
Malaysia can claim more success than most countries in managing relative inequality. The Gini index of household incomes fell from 0.51 in 1970 to 0.40 in 2016; for developing countries as a whole, average inequality has been roughly unchanged over a similar period.
However, one should not confuse relative inequality with absolute inequality. Figure 1 shows both the standard relative Gini index based on household incomes (as used by Malaysia’s Statistics Office) and the corresponding absolute index, based on the mean absolute gaps between all pairs of households. We see a marked rise in absolute inequality.
Figure 1 Absolute and relative Gini indices of household incomes for Malaysia, 1970-2016
Note: The absolute index is scaled to equal the relative index in 1970. Source: Author’s calculations from official data.
In my paper I provide new measures of ethnic inequality spanning 50 years. Figure 2 gives the indices using both the Gini index and one of the Theil indices, namely, the mean log deviation (MLD). These show a large reduction in relative ethnic inequality. The inter-ethnic Gini index has fallen substantially, from 0.20 in 1970 to 0.07 in 2016.
Figure 2 Ethnic inequality indices
Source: Author’s calculations from official data on household incomes.
I find that the decline in the national Gini index is largely accountable to the country’s progress in reducing the Gini index of between-group inequality. The other components of overall inequality – the properly weighted within-group component and the overlap component reflecting the interaction between the between and within components – have been essentially stationary over the longer term. However, this also reflects the properties of the Gini index, whereby the weights on the within-group component do not sum to unity. Indeed, for these data the sum falls over time, down-weighting the contribution of within-group inequality reductions. The Gini index trended downward within each of the main ethnic groups.
The ethnic differential in growth rates has not been enough to attenuate the large absolute gaps in mean incomes by ethnicity, given the extent of the initial ethnic inequality. Relative ethnic inequality has fallen, but absolute ethnic inequality has risen. The data do not support the claim that the (absolute) income gap between Malays and Chinese- and Indian-Malaysians has narrowed dramatically; indeed, one might be more inclined to say that the gap has risen dramatically over the longer term.
Importantly, I find no sign in the data of a robust effect of the growth process on inequality within ethnic groups. It is not the case, for example, that the higher growth rate for the Bumiputera in the wake of the NEP was shared unevenly among the Bumiputera when one defines ‘uneven’ in terms of proportionate changes. Nor do I find any sign that the policy efforts to reduce ethnic inequality during the NEP period came with a lower overall rate of growth in mean household incomes.
A closer look at the progress against poverty
Malaysia’s official poverty measures indicate one of the fastest long-term rates of poverty reduction in the world. Judged by Malaysia’s poverty line, the only country I know that has seen a faster rate of poverty reduction over the longer term is neighbouring Thailand (using Malaysia’s official poverty line, at purchasing power parity rates of exchange, for making these comparisons; see Ravallion 2019).
I find that Malaysia’s success in reducing income inequality played an important role in the country’s success at reducing poverty, in combination with economic growth. Lower inequality (a pro-poor shift in distribution at a given mean) accounted for 25% of the reduction in absolute poverty, with growth in mean income accounting for the rest.
To quantify the contribution of lower ethnic inequality, I propose a new decomposition method. I identify four components of the rate of poverty reduction: (i) a pure growth component; (ii) an ethnic inequality component allowing within-group inequality to change; (iii) a component reflecting intra-ethnic distributional shifts not accountable to growth in the group-specific means; and (iv) a population composition component reflecting ethnic differences in population growth rates. On implementing this decomposition, I find that about 10% of the overall rate of poverty reduction is accountable to reduced inequality in average incomes between the main ethnic groups. Growth in mean income has been the more important driver quantitatively. Changes in the ethnic composition of the population tended to be poverty increasing, though this effect turns out to be small.
The claim one hears often in some circles in Malaysia that the country has virtually eliminated poverty is questionable, however. The current official poverty line is almost certainly too low by prevailing standards of what ‘poverty’ means in a country such as Malaysia. I have proposed a new set of weakly relative poverty lines that yield a line for Malaysia that is at the level one would expect to find for a country at its level of economic development. (On the idea of weakly relative poverty, see Ravallion and Chen 2011.) Using these new measures, I find that about 20% of the population is still poor. Nonetheless, I still find that there has been huge progress against poverty (for example, 41% were poor by this measure in 1984). Figure 3 compares the progress over time using both an absolute measure (anchored to the official poverty line and using household income per capita) and my weakly relative measure. Using my weakly relative measure, lower inequality accounts for a larger share of Malaysia’s progress against poverty, though growth in the mean still accounts for the majority.
Figure 3 Comparison of absolute and relative poverty measures for Malaysia
Source: Author’s calculations using the World Bank’s PovcalNet.
While the reduction in ethnic inequality has not been as quantitatively important to poverty reduction as overall growth that does not imply that ethnic redistribution is a blunt tool against poverty in this setting. Nor do the facts that both ethnic inequality and poverty have been reduced substantially imply that ethnic inequality no longer matters to poverty in Malaysia. Indeed, I find quite sizable elasticities of national poverty to inequality-reducing ethnic redistribution at a given mean income. And the elasticities have stayed high – indeed, they have increased – through this period of ethnic redistribution and poverty reduction spanning 50 years.
Concluding remarks
Malaysia’s long-term effort to reduce ethnic/racial disparities in living standards has played an important role in its ability to manage overall relative inequality. That effort has also helped reduce poverty, although on that score overall economic growth has been more important. However, the potential gains to poor Malaysians from progress toward ethnic equality do not appear to have been exhausted. Going forward, even small reductions, or increases, in ethnic inequality can still matter.
Author’s note: My research on this topic was done while visiting the Ungku Aziz Centre in the Faculty of Economics, University of Malaya, in January 2019. Many thanks to the Faculty for their hospitality.
References
Economist (2017), “Deformative Action: Malaysia’s System of Racial Preferences should be Scrapped”, 18 May.
Khalid, M A (2014), The Colour of Inequality. Ethnicity, Class, Income and Wealth in Malaysia, MPH Publishing.
Ravallion, M (2019), “Ethnic Inequality and Poverty in Malaysia Since 1969,” NBER Working Paper 25640.
Ravallion, M, and S Chen (2011), “Weakly Relative Poverty,” Review of Economics and Statistics 93(4): 1251-1261.
Thillainathan, R, and K-C Cheong (2016), “Malaysia’s New Economic Policy, Growth and Distribution: Revisiting the Debate,” Malaysian Journal of Economic Studies 53(1): 51-68.


