The modern-day backlash against immigration has led to calls for tighter border restrictions, such as President Trump’s proposed wall on the Mexico–US border, or the ban on immigration from certain Muslim nations. This backlash partly stems from the worry that immigrants are slow to assimilate – an argument that echoes historical anti-immigrant sentiment against Southern and Eastern Europeans, Catholics, and Jews.
Despite the response they faced at the time, immigrant groups from the past are now perceived to have integrated well. It is possible that the future will hold a similar shift in perception of modern-day migrants. After all, immigrants today and in the early 20thcentury follow many similar assimilation patterns. For example, immigrants adopt less foreign-sounding names (Abramitzky et al. 2017) and improve their occupations relative to native-born Americans at similar rates between now and then (Abramitzky et al. 2014).
Another way in which immigration today resembles that of the early 20thcentury is in the extent of segregation from the US-born (Cutler et al. 2008). Segregation has long been considered a key measure of assimilation since it has important effects on immigrant outcomes. For example, segregation can harm immigrants if it leads to lower rates of English acquisition or if immigrant enclaves have lower quality schools and higher rates of crime. On the other hand, migrant neighbourhoods may boost outcomes for new arrivals by connecting them to jobs or providing them with housing.
To understand the effects of segregation, one must first be able to measure segregation in a way that is comparable across areas and across time; unfortunately, the comparability of available segregation measures from American history is hindered by limitations of published census reports. Instead of using census reports to measure segregation, in a recent paper we take advantage of newly digitised historical censuses between 1850 and 1940 (Eriksson and Ward 2018). Using a new method developed by Logan and Parman (2017) that takes advantage of the extreme detail within census records, we measure segregation based on the nativity of the next-door neighbour. Besides being the finest level of detail possible, this method also allows us to measure segregation in areas not previously covered, such as rural areas where over half of the immigrant population lived in the 19thcentury.
The long-run trends of ethnic segregation
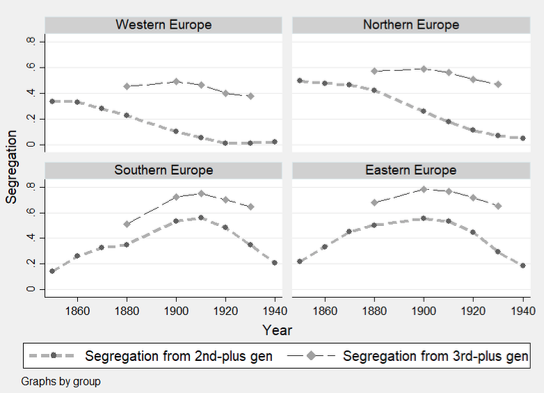
We first provide a long-run picture of how segregation changed for the entire US between 1850 and 1940. As Figure 1 shows, segregation patterns mostly follow long-run immigration flows from each source region. For example, immigrants from Western Europe were most segregated during their peak immigration decades in the 1850s and 1860s. For later-sending countries in eastern and southern Europe, segregation peaked at the same time as inflows did around 1910. Segregation for all European sources fell after the immigration quota acts of the 1920s, laws which ended the open-door policy of the US.
Figure 1 Long-run trends in neighbour-based segregation between 1850 and 1940
Source: Eriksson and Ward (2018).
The fall in segregation after WWI and the 1920s immigration quotas suggests that immigrants spatially integrated rapidly after staying more years, but the fall in segregation is somewhat misleading. The native-born that immigrants lived near were often the children of immigrants from the same source country; if one instead measures segregation from the third-plus generation (that is, US-born to US-born parents), then the level of segregation was higher. This pattern is true for all countries irrespective of the overall level of segregation, so the relatively low level of segregation for Western Europeans still masks segregation from longer-established Americans. Moreover, the fall in segregation during the early 20th century was less rapid if one measures segregation from the third-plus generation. This suggests that one way in which immigrants spatially integrate with native-born neighbours is to first live near second-generation immigrants and then near third-generation immigrants.
Segregation was high outside of major cities
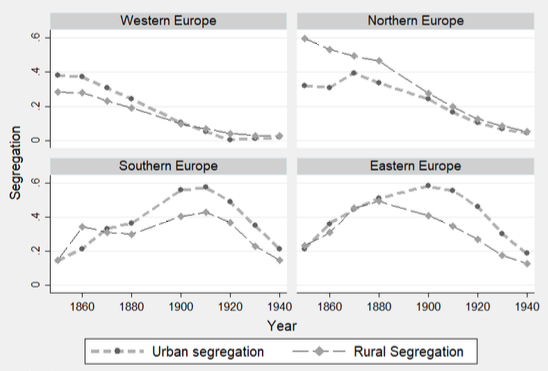
Ethnic segregation during this period is often associated with enclaves in major cities, such as the Italians in early 20th century New York, or the Irish in mid-19th century Boston; however, our estimates indicate that segregation was often even higher in rural areas, especially for Northern Europeans (see Figure 2). For example, rural Norwegians in the mid-19th century were more segregated than their urban counterparts – and more segregated than the mid-19th century urban Irish and early 20th century urban Italians. Since ethnic segregation was high in rural areas, it was not simply the result of urban phenomena such as the rise of mass transit or urban factories, but also reflected cultural and economic benefits from living near other immigrants.
Figure 2 Long-run trends in urban and rural segregation between 1850 and 1940
Source: Data from Eriksson and Ward (2018).
Segregation was not only high in rural areas, but also in the less-populated factory towns outside of the major ports. During the mid-19th century, many textile plants hired the thousands of Irish fleeing the Great Famine, resulting in a sharp rise in the fraction of immigrants in these industries (Ferrie 2018). Our measure also captures the high level of segregation in these small towns; for example, from 1850 to 1870 the most segregated groups were the Irish in mill towns of the northeast such as Lowell and Fall River, Massachusetts. Later in the 20thcentury, some of the most highly segregated areas were for Eastern Europeans in the mining counties in western Pennsylvania. Mexicans were also highly segregated in the agricultural and mining counties in the American southwest.
Slow rate of spatial assimilation for early 20th century arrivals
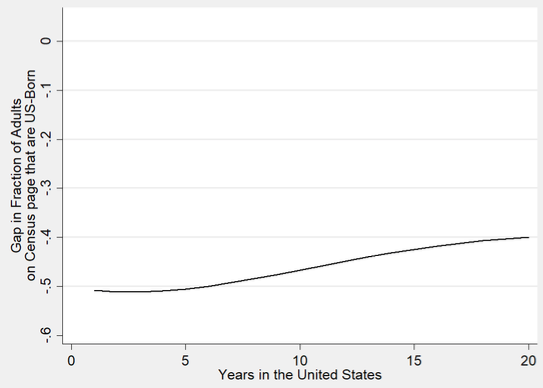
Finally, an important question about assimilation is what drives increases or decreases in segregation over time – is it the arrival of new immigrants or movement of established immigrants to less segregated neighbourhoods? To understand how segregation changes with more years of stay, we use a longitudinal dataset that follows immigrants who arrived between 1900 and 1919 from census to census (Ward 2018). Figure 3 plots the trajectory of immigrants’ level of segregation (measured by the proportion of native-born neighbours on the same census page) and shows that immigrants spatially assimilated at a slow rate in the first twenty years in the US. At arrival, 40% of immigrants’ neighbours were native-born Americans, in comparison with 90% of neighbours for native-born Americans (for a gap of 50 percentage points). After twenty years of stay, this gap closed from 50 to only 40 percentage points.
Figure 3 The rate of spatial assimilation for early 20th century arrivals
Source: Eriksson and Ward (2018)
Overall, the results suggest that segregation between 1850 and 1940 was more widespread across the US than previously recognised. Segregation was high not only in cities, but also in small factory towns, mining towns, and rural communities. We are only beginning to learn about the effects of segregation during this period; for example, living in a denser enclave negatively affected Norwegian immigrant outcomes (Eriksson 2018). Despite the high levels of segregation in some places, immigrants on average tended to culturally assimilate at a fast rate in terms of acquiring English fluency and adopting Americanised names (Abramitzky et al. 2017, Ward 2018). Either way, since spatial assimilation was relatively slow in the early 20thcentury, it would not be surprising if modern-day immigrants are also slow to live near other US-born households. Immigrants in the past still assimilated well economically despite segregation, so slow spatial integration does not necessarily imply slow assimilation on other margins.
References
Abramitzky, R, L Platt Boustan and K Eriksson (2014), "A nation of immigrants: Assimilation and economic outcomes in the age of mass migration,” Journal of Political Economy 122(3): 467–506.
Abramitzky, R, L Platt Boustan and K Eriksson (2017), “Cultural assimilation during the Age of Mass Migration,” NBER, Working Paper 22381.
Cutler, D M, E L Glaeser and J L Vigdor (2008), "Is the melting pot still hot? Explaining the resurgence of immigrant segregation," Review of Economics and Statistics 90(3): 478–497.
Eriksson, K and Z Ward (2018), “The ethnic segregation of immigrants in the United States from 1850 to 1940,” NBER, Working Paper 24764.
Eriksson, K (2018), “Ethnic enclaves and immigrant outcomes: Norwegian immigrants during the Age of Mass Migration,” NBER, Working Paper 24763.
Ferrie, J P (2018), “Immigration in American economic history,” The Oxford Handbook of American Economic History 1: 101–118.
Ward, Z (2018), “Have language skills always been so valuable? The low return to English fluency during the Age of Mass Migration,” manuscript.


