From a “European Union” perspective, the European patent system is highly fragmented. Indeed, it is actually a sum of 27 national patent systems – once a patent is granted it must be upheld, managed, and enforced at the country level. In case of litigation, it is frequent for applicants to be involved in several parallel litigations, with different outcomes across countries. With the creation of an EU patent and a centralised litigation system, Harhoff (2009) shows that at least €120 million would be lost by patent lawyers (no more parallel litigations), and hence spared by the business sector.
The current fragmentation reduces the effectiveness and attractiveness of the European patent system, particularly through its prohibitive costs and the economic incongruities it generates (see van Pottelsberghe 2009 and Meyer and van Pottelsberghe 2009). In this respect, the implementation of the EU patent would not only reduce costs but would also improve the attractiveness and effectiveness of the system.
Our recent work (Danguy and van Pottelsberghe 2009) aims to assess what would be the budgetary consequences of the EU patent for national patent offices and the European Patent Office. Our chosen simulation methodology is aimed at comparing the renewal fees’ receipts of an average European patent (under the current system) with the renewal fees’ receipts generated by an average patent under the future EU patent.
How much income would the EU patent generate?
The answer is not straightforward, as the total renewal fees’ income generated by the EU patent depends not only on the renewal fees that the applicant has to pay but also on the maintenance rates, i.e. the probability that a patent is maintained each year after grant. In fact, the decision to patent and to maintain a patent depends on many factors (see for example Cornelli and Schankerman 1999, Harhoff et al. 2009). The share of active patents continuously drops over time and strongly varies across countries. Therefore, the maintenance rate is a key parameter for the calculation of the total revenue generated by a patent. In this context, our results show that:
- the higher the GDP – reflecting the market attractiveness of a country –, the higher is the maintenance rate;
- the older a patent, the lower the maintenance rate;
- the stronger the patent system, the higher the maintenance rate; and
- the higher the renewal fees, the lower the maintenance rate.
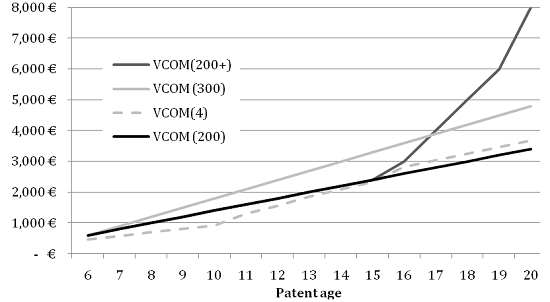
Taking into account the estimated elasticity, the maintenance rate of an average EU patent can be simulated and primarily varies with respect to the chosen fee structure. The renewal fees schedule is therefore a key policy leverage in practice and more than a simple way to cover the operating costs of patent offices. As illustrated in Figure 1, different structures of renewal fees can be considered for the EU patent.
Figure 1. Possible fee structures for the EU patent
One approach consists in summing up the renewals fees of the four most designated countries (called VCOM(4)). An alternative – and somewhat simpler option – would be composed of a starting fee of €600 on year 6 of the patent age and then an increment each additional year in the patent age (see the solid lines on Figure 1). VCOM(200) and VCOM(300) characterise such a fee structure with a yearly increment of €200 and €300, respectively. VCOM(200+) is the same as VCOM(200) up to year 15 and then increases exponentially to reach €8,000 at year 20.
The VCOM(200+) seems to be the most appropriate fee schedule because it is what the business sector seems ready to pay. Indeed, van Pottelsberghe and van Zeebroeck (2008) show that 15-year-old patents are on average maintained (or renewed) in four countries.
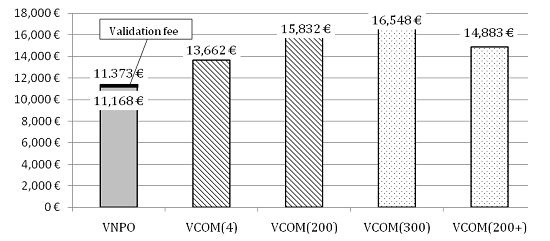
With the simulated maintenance rates and different fees schedule for the EU patent, we are able to calculate the renewal fees’ income that would be generated by an average EU patent over its life time (after grant), as shown in Figure 2.
Figure 2. Simulated total renewal fees’ income under the EU patent
Source: Danguy and van Pottelsberghe 2009
The first bar (VNPO) corresponds to the actual fees income generated by an average current European patent granted by the European Patent Office – a bit more that €11,000. This amount can be compared to the total renewal fees’ income generated by an average EU patent, which would obviously vary with the level of fees from nearly €13,600 with the VCOM(4) renewal fees schedule up to €16,600 with the VCOM(300) renewal fees schedule. In other words, the EU patent would generate at least the same amount of cumulated fees’ income as the current European patent, and probably substantially more, thanks to higher fees and higher maintenance rates. With the simpler and preferred VCOM(200+) fees schedule, the total income generated by one EU patent would be 130% higher than the current total income generated by one European patent.
Higher income for patent offices...
The key issue is now to assess to what extent the EU patent would actually affect each national office’s income. The answer would obviously depend on the adopted distribution key between offices, as it is shown in Table 1. The “council proposal” weighting scheme reflects the outcome of political negotiations and is quite complex. The population weighting scheme would reward large countries but not their innovation or economic performances. Therefore, the GDP or R&D weighting schemes seem to be the simplest, fairest, and most effective distribution keys.
Table 1. National patent office renewal fees income under European patent (VNPO) and EU patent with the VCOM(200+) renewal fees schedule
|
|
VNPO
|
Level (€)
|
Relative net differences (%)
|
|
|
€
|
Proposed
|
GDP
|
Population
|
R&D
|
Proposed
|
GDP
|
Population
|
R&D
|
|
European Patent Office
|
5686
|
7441
|
7441
|
7441
|
7441
|
31
|
31
|
31
|
31
|
|
Germany
|
2386
|
1957
|
1483
|
1236
|
2032
|
-18
|
-38
|
-48
|
-15
|
|
France
|
802
|
819
|
1155
|
953
|
1309
|
2
|
44
|
19
|
63
|
|
UK
|
597
|
729
|
1222
|
915
|
1175
|
22
|
105
|
53
|
97
|
|
Netherlands
|
332
|
551
|
345
|
246
|
320
|
66
|
4
|
-26
|
-4
|
|
Austria
|
227
|
424
|
164
|
125
|
218
|
87
|
-27
|
-45
|
-4
|
|
Italy
|
576
|
677
|
946
|
888
|
581
|
18
|
64
|
54
|
1
|
|
Spain
|
230
|
454
|
628
|
669
|
408
|
97
|
173
|
190
|
77
|
Source: Danguy and van Pottelsberghe 2009
It clearly appears that the European Patent Office and most national offices would actually gain more with the EU patent than with the European patent thanks to a much higher total income generated by one average EU patent (see Figure 2).
... with lower patenting costs for applicants
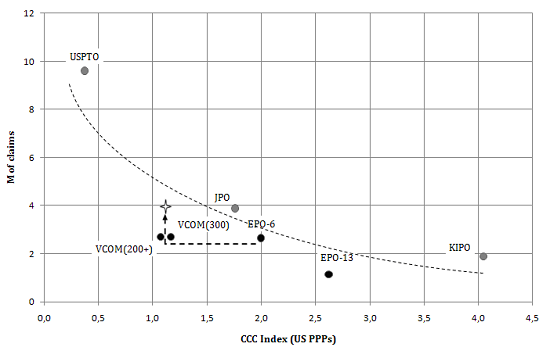
While generating higher income, the EU patent would also reduce the relative patenting costs since it will cover the European market of about 500 million of inhabitants. Accounting for the size of the market (capita) and the size of the patent (claim), Figure 3 shows that the cost per claim per capita (CCC) indicator would place Europe between Japan and the US.
Figure 3. Relative patenting costs and the demand for patents
Note: The cost per claim per million capita is expressed in US PPPs, and includes the cumulated costs for up to 10 years of protection. Source: Danguy and van Pottelsberghe 2009
The 45% decrease in relative prices due to the implementation of the COMPAT would therefore induce a 14% increase in the demand for patents at the European Patent Office, all else being equal.
In a nutshell, the EU patent with a unified jurisdiction would reduce both the costs and uncertainty currently associated with the fragmented European patent system, while quality in the examination process would be held stable thanks to relatively high absolute renewal fees. The beneficial effects of the COMPAT (cost savings, construction of the single market, lower complexity) would make the patent system more accessible for small- and medium-sized enterprises and for universities in Europe. At the same time it would make the European market much more attractive for both domestic and foreign companies.
References
Cornelli F and M Schankerman (1999), “Patent Renewals and R&D Incentives”, RAND Journal of Economics, 30(2):197-213.
Danguy J and B van Pottelsberghe de la Potterie (2009), “Cost-Benefit Analysis of the Community Patent”, Bruegel Working Paper 2009/08 and ECARES Working Paper 2010-012.
de Rassenfosse G and B van Pottelsberghe de la Potterie (2010), “The role of fees in patent systems: Theory and evidence”, CEPR Discussion Paper 7879.
Harhoff D (2009), “Economic Cost-Benefit Analysis of a Unified and Integrated European Patent Litigation System”, Final Report, Tender No MARKT/2008/06/D, 84 pages.
Harhoff D, K Hoisl, B Reichl and B van Pottelsberghe de la Potterie (2009), “Patent Validation at the Country Level – the Role of Fees and Translation Costs”, Research Policy, 38(9):1423-1437.
Mejer M and B van Pottelsberghe de la Potterie (2009), “Economic incongruities in the European Patent Systems”, Bruegel Working Paper 2009/01 and ECARES Working Paper 2009-03.
van Pottelsberghe B (2009), “Lost Property : The European patent system and why it doesn’t work”, Bruegel Blueprint, Brussels, Belgium.
van Pottelsberghe de la Potterie B and D François (2009), “The cost factor in patent systems”, Journal of Industry, Competition and Trade, 9(4):329-355.
van Pottelsberghe de la Potterie B and N van Zeebroeck (2008), “A brief history of space and time: the scope-year index as a patent value indicator based on families and renewals”, Scientometrics, 75(2):319–338.


