On 29 March 2019 the UK will withdraw from the EU. This unprecedented event in the history of European integration raises many questions on the trade relationship between the two economies, among other things. The ratification of the Withdrawal Agreement by the UK parliament is still uncertain and the consequence of a ‘no-deal’ Brexit are that EU-UK bilateral trade would be based on WTO most-favoured nation (MFN) terms.
While the potential rise of trade barriers and their direct effects on consumers have attracted the most attention (Corsetti et al. 2017, Dhingra et al. 2017), with a few exceptions (Vandenbussche et al. 2107, Pisani and Vergara Caffarelli 2018) the Brexit debate has neglected the indirect effects of trade tariffs, working through the complex network of production linkages between countries known as global value chains (GVCs). And yet, their relevance is likely to be sizable, given the strong cross-border integration of production between the two economies. Tariffs on imported intermediate goods (embedded in exported goods) will cumulate as many times as the intermediates cross the EU-UK border. Furthermore, a significant share of goods and services reach destination countries only indirectly through other countries' exports, and thus face trade costs that are not immediately evident (for example, Italian intermediate exports to Germany incorporated in goods destined for the UK market could be subject to tariffs while crossing the Channel, but this might not be obvious to the Italian firms).
Measuring the interconnections between countries and sectors is not an easy task. In fact, traditional trade statistics cannot provide an adequate representation of supply and demand linkages. In a recent paper (Cappariello et al. 2018), we exploit the World Input-Output Database (Timmer et al. 2015) to map production and consumption linkages between the two economies. By combining these data with new tools of analysis (Borin and Mancini 2017), we provide a measure of the cost of trade flows that takes into account the whole EU-UK GVC structure. Our analysis is a static impact assessment that does not consider how trade between the two regions will evolve due to the introduction of tariffs (and non-tariff barriers).
Our working assumption is that the UK would adopt the current MFN tariff schedule adopted by the EU, which is indeed the worst-case scenario of the EU-UK post Brexit relationship. Namely, we assume that UK goods exports will be subject to the tariffs currently applied by the EU (and the UK) to partners with which there is no specific trade agreement. To this end, a tariff schedule both for the EU and the UK is constructed at the sector and at the end-use levels, using the MFN tariff rates. The UK recently announced that in case of no deal, British MFN tariffs will be moderately lower than the current EU MFN tariffs. Should this be confirmed, our results will represent an upper bound for the actual economic effects.
The impact on production costs of tariff magnification along the EU-UK GVCs
To assess the associated trade costs of Brexit, our calculated tariff schedule for both the EU and the UK is fed through the constellation of GVCs described in the WIOD, so that we can gauge the full extent of the magnification due to these deep sectoral/country inter-linkages (Table 1). The analysis – based on the methodology proposed by Miroudot et al. (2013) – estimates that the impact on producers is much higher for the UK, where total (domestic and foreign) manufacturing input costs would increase on average by around 0.9 percentage points. In the EU the increase would be marginal (0.1 percentage points). This result is due to the specific links between the two regions: around one fifth of the total manufacturing inputs used by the UK come from the EU, while only 1.5% of the total EU inputs are imported from the UK. The UK sectors most highly involved in the EU-UK GVCs, such as motor vehicles and chemicals, would experience the largest effect. Finally, the impact on production costs would be high in Ireland due to its proximity and interconnectedness with the UK, and close to, or lower than, the average in other large EU member states.
Table 1 Total effect of tariffs on production costs
(as a percentage of total costs for inputs, domestic and imported)
Direct and indirect tariffs on EU-UK trade
Table 2 shows the average tariffs that would be imposed on EU imports from the UK in the manufacturing sector and in some specific sectors. Similarly, Table 3 presents the tariff magnification effect for UK imports from the EU. The overall average tariff cost on UK goods imported in the EU is 4.3% and the share of the indirect tariff component, i.e. the tariff costs deriving from the existence of value chains, equal to 10% of the total, which is the effect of tariff accumulation due to back-and-forth trade across the Channel.
Table 2 Tariff magnification effects on EU imports from the UK
(as a percentage of the value of imports)
Table 3 Tariff magnification effects on UK imports from the EU
(as a percentage of the value of imports)
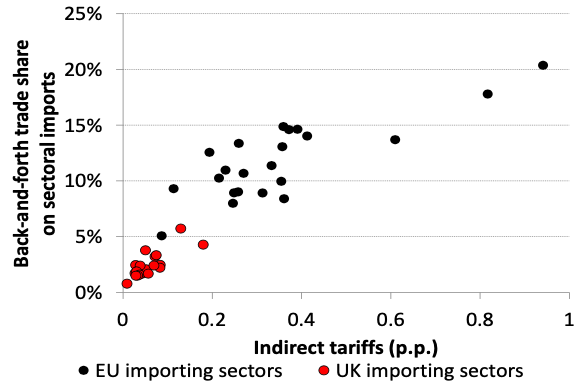
The indirect tariffs, i.e. tariffs induced by GVCs, are significant for European but not for UK importers. European producers perform processing stages in the UK to a larger ex-tent than the reverse (i.e. UK producers shipping intermediate goods to EU countries and importing them back as final goods). Therefore the magnification of the tariff burden due to products crossing the Channel at different production stages weighs more on EU final exports: in UK exports to the EU the share of value added produced in the EU is around 9%, while for EU exports to the UK the UK value added share is just 2%.
As shown in Figure 1, the amount of indirect trade costs is positively correlated with the share of the back-and-forth trade between the two economies. In the longer run this could induce EU exporters to divert their exports of intermediate goods currently destined to the UK to other EU countries.
Figure 1 Back-and-forth trade and indirect trade costs
Note: Authors’ calculations on WIOD data. The figure plots, for each sector in both the EU and the UK, the indirect tariff and the share in bilateral imports of the value added originated in the other economy (a measure of back-and-forth trade).
Conversely, the amount of direct tariffs would be larger for UK importers due to the com-position of UK imports, which are skewed towards high-tariff sectors, in particular food products and motor vehicles.
This latter effect prevails and, as a result, total tariffs, direct and indirect, would be higher on average for UK importers than for EU importers by around 2 percentage points.
Indirect exports and the introduction of tariffs
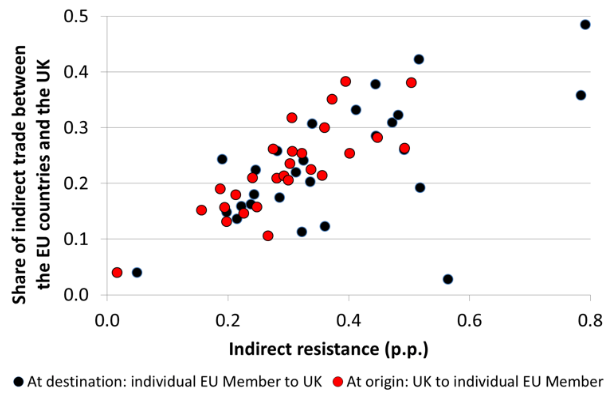
As to the export side, we exploit the methodology developed in Muradov (2017) to show that, given the density of intra-EU linkages and the sizeable share of indirect trade between the two regions (approximately one-fifth in either direction), exporters in both the UK and the EU member states would face much higher costs once indirect trade is taken into ac-count. In other words, the trajectory of exports towards their destination matters, and indirect routes entail tariffs not easily assessed by the original exporters (as intra-EU trade is free of tariffs), but account for around 25% of the tariff costs for EU exporters and 22% for UK exporters. Not surprisingly, the share of indirect tariffs and indirect trade between the EU member states and the UK are highly correlated (Figure 2).
Figure 2 Indirect trade and indirect tariffs, by EU member state
Note: Authors’ calculations on WIOD data. The figure plots, for each EU Member State and the UK, the resistance at the origin for UK exports to the EU Member States (in red), and the resistance at the destination for EU Member States’ exports to the UK (in black) and the corresponding share in indirect ex-ports.
Authors’ note: The opinions expressed here are the authors’ own and not those of the Bank of Italy.
References
Borin, A and M Mancini (2017), “Follow the Value Added: Tracking Bilateral Relations in Global Value Chains”, MPRA Paper 82692, University Library of Munich.
Cappariello R, M Damjanovic, M Mancini, F Vergara Caffarelli (2018), “EU-UK Global Value Chain trade and the indirect costs of Brexit”, Banca d’Italia, Occasional Papers No. 469.
Corsetti G, M Crowley, O Exton and L Han (2017), “A granular analysis of the exposure of UK exports to EU tariffs, quotas and antidumping under ‘no deal’”, VoxEU.org, 13 December.
Dhingra, S, H Huang, G Ottaviano, J P Pessoa, T Sampson and J Van Reenen (2018), “The costs and benefits of leaving the EU: Trade effects”, Econonomic Policy 32: 651–705.
Koopman, R, Z Wang, and S-J Wei (2014), “Tracing Value-Added and Double Counting in Gross Exports,” American Economic Review 104: 459-94.
Miroudot, S, D Rouzet, and F Spinelli (2013), “Trade Policy Implications of Global Value Chains: Case Studies,” OECD Trade Policy Papers 161.
Muradov, K (2017), “Trade costs and borders in global value chains,” Review of World Economics (Weltwirtschaftliches Archiv) 153: 487-509.
Pisani M and F Vergara Caffarelli (2018), “What will Brexit mean for the British and eu-ro-area economies? A model-based assessment of trade regimes”. Banca d’Italia Working Papers No. 1163.
Timmer, M P, E Dietzenbacher, B Los, R Stehrer, and G J de Vries (2015), “An Illustrat-ed User Guide to the World Input-Output Database: the Case of Global Automotive Production”, Review of International Economics 23: 575-605.
Vandenbussche H, W Connell and W Simons (2017), “Global value chains, trade shocks and jobs: An application to Brexit”, VoxEU.org, 27 November.


