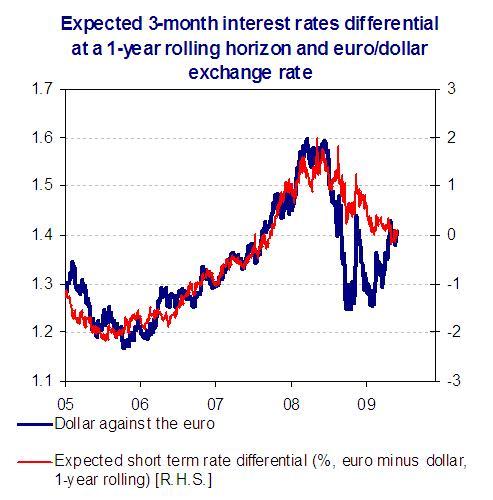
Trying to forecast foreign exchange rates is challenging. Understanding their past behaviour is not much easier. In this respect, the bumpy road followed by the dollar against the euro during the last two years seems to be no exception. Nonetheless, a look at Figure 1 gives some interesting clues. It compares the rate of the euro in dollars and the difference in 3-month rates on the two currencies expected at a one year rolling horizon. Until last year, the two variables appear to have been strongly correlated. This should not be a complete surprise. In a globalised world, interest rate differentials greatly influence foreign exchange markets, and one could assume that the euro and dollar forward rates capture the average levels of the relevant part of the two yield curves.
Figure 1. Expected interest rates differences and the euro-dollar exchange rate
Since 2005, changes in expected monetary policies seem to have been the driving force behind recent exchange rate movements – at least until last year. Then the correlation clearly breaks down. But this is not totally surprising. After all, how are interest rates supposed to influence exchange rates? Currency traders borrow in a low-rate currency and lend in a higher rate one. By doing so, they push the value of the former down against the latter. But that requires that borrowing is relatively easy and that exchange rate risks (or risk aversion) are low. What happens if those circumstances break down? The influence of return differentials will suddenly be diminished.
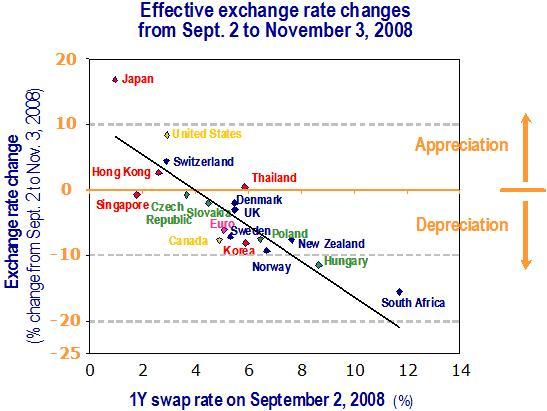
Did the break in risk-taking behaviour that took place during the financial crisis affect exchange rate markets? If the influence of differentials in expected returns on exchange rates is a decreasing function of risk aversion, a brutal increase in risk aversion will – everything else being equal – push higher interest rate currencies down against lower interest rate ones. Figure 2 shows what happened last fall for about twenty currencies. It gives the level of their one-year interest rate at the beginning of September 2008 and the change in their nominal effective exchange rate over the following two months. The relationship is clear – the higher the interest rate before the shock, the bigger the following fall in the exchange rate. The significant appreciation of the low-yielding currencies – the dollar and the yen, notably – after Lehman Brothers’ bankruptcy thus seems to have been the direct consequence of a sharp increase in risk aversion. The move of the euro also fits into this global picture.
Figure 2. Effective exchange rate changes, September to November 2008
Can this help understand the hectic moves of the euro-dollar exchange rate during the last 18 months? To find out, we constructed a simple framework to simulate the level of the euro exchange rate assuming it responds only to changes in expected return differentials, the elasticity of this response being given by a parameter inversely related to risk aversion.1 The return differential is taken as the difference in interest rates of Figure 1 plus an expected rate of change in the exchange rate (assumed to be constant over the whole period). Calibrated to 2005-2007, this framework replicates the euro-dollar exchange rate well over those three years (Figure 3). But, exactly as the relationship depicted in Figure 1, it breaks down by mid-2008. If the “break-in-risk-aversion” assumption explains what happened at the height of the crisis (as Figure 2 suggests), can fluctuations in risk aversion explain the path followed by the euro-dollar exchange rate since the beginning of the financial crisis?
Figure 3. Forecasting the euro-dollar exchange rate
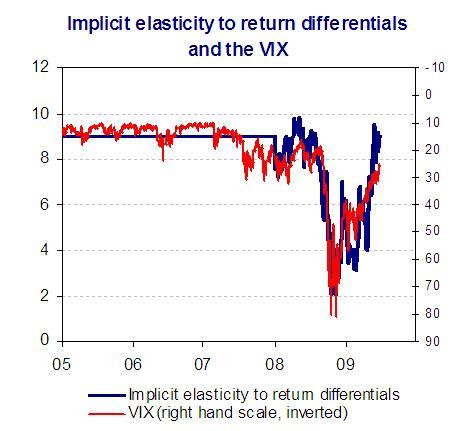
To answer this last question we use our framework to calculate the path the elasticity to return differentials parameter should have followed to correctly simulate the observed exchange rate trajectory beginning in January 2008 (Figure 4). Unsurprisingly, this implicit elasticity started to fall significantly – it moves in the opposite direction of risk aversion – at the beginning of 2008 before collapsing after Lehman went under. It then slowly and hesitatingly moved back to more normal levels and by June of this year it was roughly back to its end of 2007 level. During this whole period, wild fluctuations in risk aversion played a key role in the euro-dollar exchange rate movements. The story makes sense, but is it consistent with what we know from risk-taking attitudes during this hectic period? The impact of the global crisis on risk aversion was not limited to foreign exchange markets (see Brender and Pisani 2007). We thus compare a commonly used risk aversion indicator – the VIX – to the calculated implicit elasticity (Figure 4). Reassuringly, the two have broadly followed the same fluctuation patterns.
Figure 4. Risk aversion and the interest rate differential elasticity
This exercise doesn’t say much about where the euro-dollar exchange rate will be in a year from now. But it tells us that expectations about monetary policy differences will regain traction in influencing foreign exchange markets as risk aversion diminishes. If markets persuade themselves that the ECB will blink first, the euro could easily move to 1.50 against the dollar. Thus far, the ECB has successfully managed to calm any such expectations (at the beginning of July, markets were pricing that, by autumn 2010, the Fed would have tightened by more than the ECB). So the euro-dollar rate could very well stay where it is for many more months… unless one of the factors that remained stable for the last years, all of a sudden starts to move as risk aversion just did!
Footnotes
1 We wrote
, where
e is the euro/dollar exchange rate (1 euro = e dollars),
is the euro expected 3-month interest rate at a 1-year rolling horizon,
is the US expected 3-month interest rate at a 1-year rolling horizon (both rates are derived from futures’ contracts prices), ε is the expected change in the euro/dollar exchange rate (taken as equal to +2 % over the whole period), β is the exchange rate elasticity to the return differentials (when risk aversion rises, β decreases), k is used here as a scale parameter.
References
Brender A. and F. Pisani, “Globalised finance and its collapse”, Dexia-Am 2007
Coudert, Virginie and Mathieu Gex, “Can risk aversion indicators anticipate financial crises?”, Financial Stability Review, Bank of France, N°9, December 2006.
Rosenberg, Michael Roy, Exchange-rate Determination: Models And Strategies For Exchange-rate Forecasting, McGraw-Hill, 2003, Chapter 1.
Smaghi, Lorenzo Bini “The euro area's exchange rate policy and the experience with international monetary coordination during the crisis”, speech at a conference entitled “Towards a European Foreign Economic Policy”, organised by the European Commission, Brussels, 6 April 2009.
