COVID-19 represents an unprecedented shock in terms of the scale and speed of its effects. On 30 January, the World Health Organization declared COVID-19 to be a public health emergency of international concern, and on 11 March it upgraded the threat to pandemic status. Extensive containment measures became indispensable to control the spread of the virus. While the source of the shock has been common to all countries, the size of the economic fallout on supply and demand has differed markedly across members of the euro area (Guerrieri et al. 2020). This is due to differences in, among other things, initial macroeconomic and financial conditions, the stringency of public health measures, and the strength of domestic fiscal measures to support the economy (which include tax deferrals, loan moratoria and guarantees, social security payments suspension, export guarantees, liquidity assistance, and short-term work schemes).
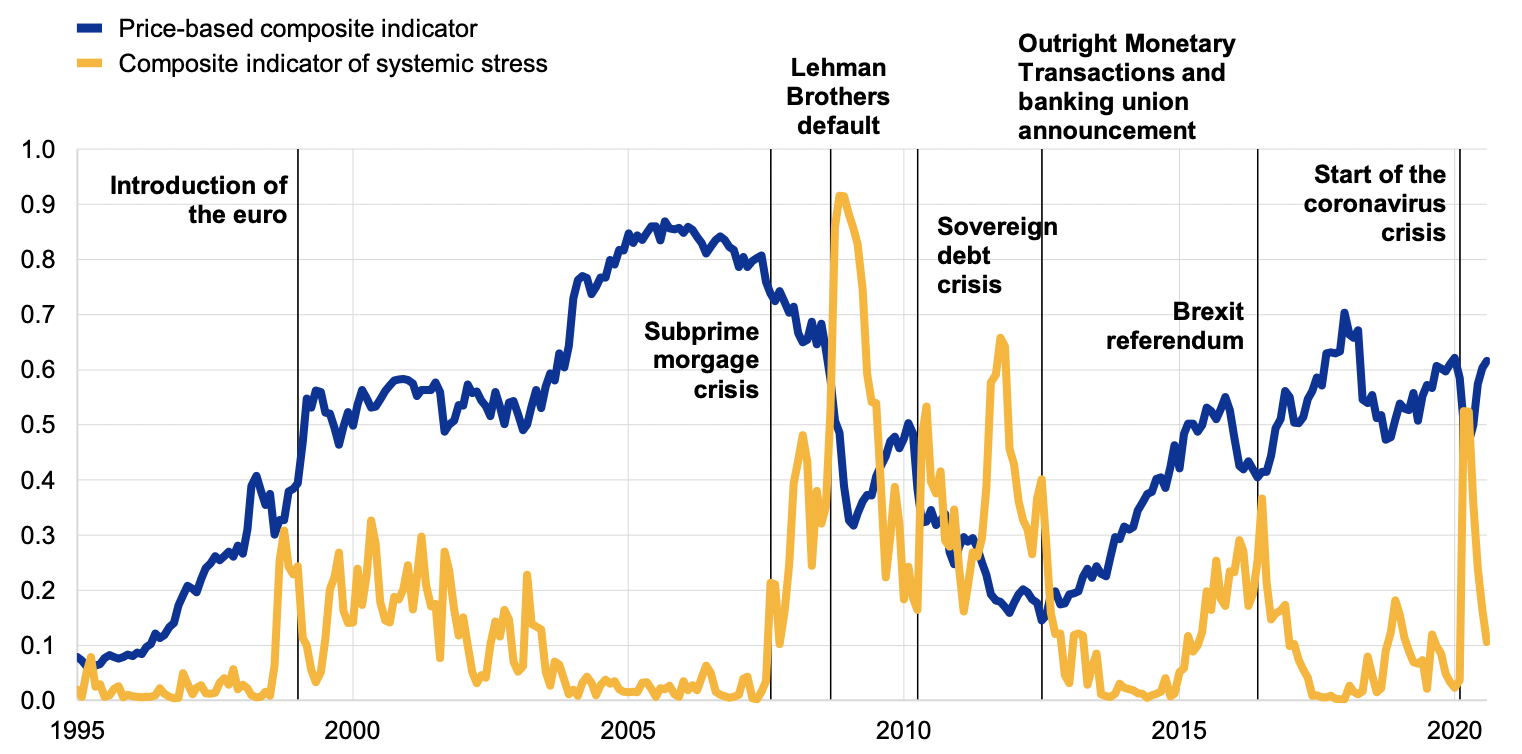
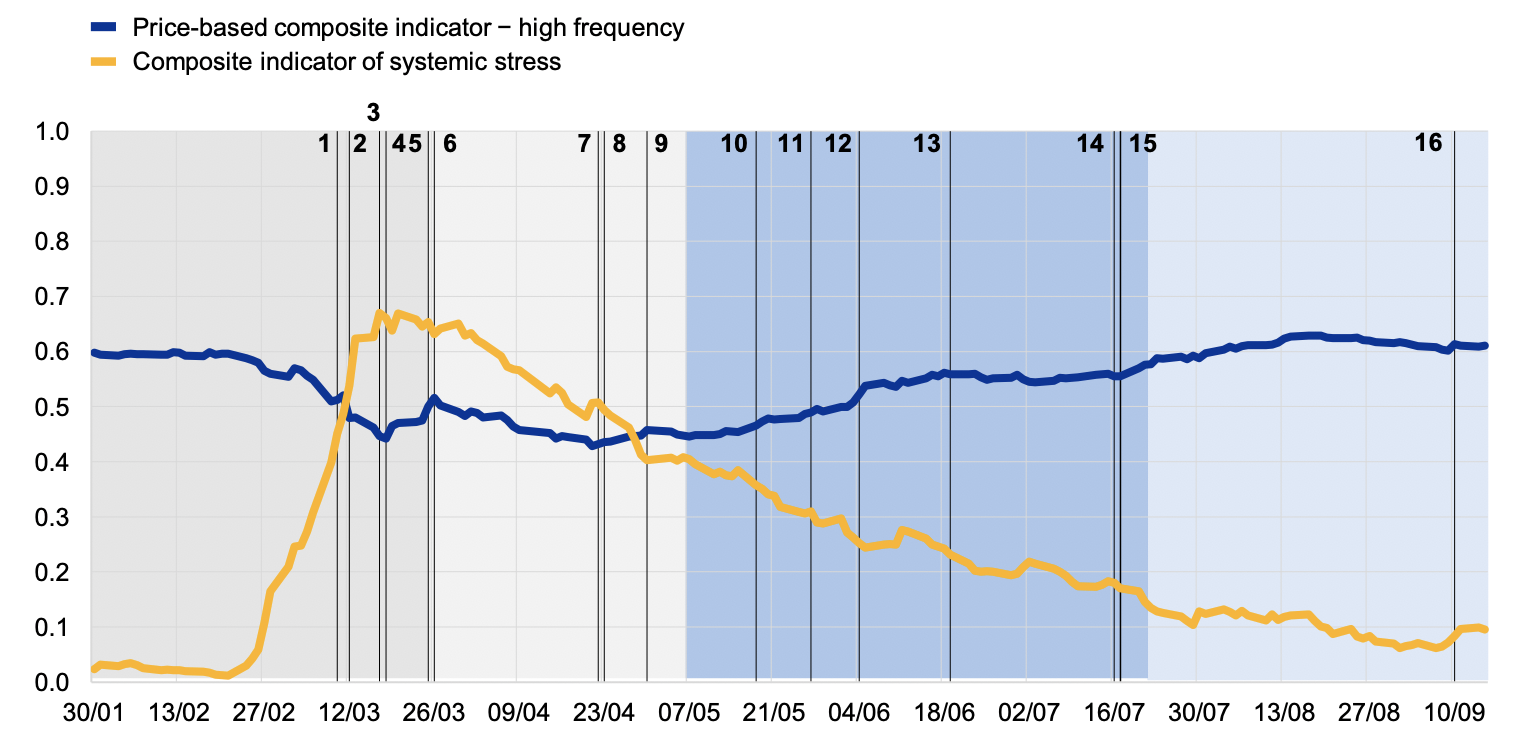
In particular, the COVID-19 crisis put euro area financial markets under extraordinary stress, leading to an initial sharp fragmentation. Within days of the first reported case of in Europe in late January 2020, the composite indicator of systemic stress (CISS) started surging towards levels close to those last seen during the global financial crisis of 2008 and the euro area sovereign debt crisis of 2011-12 (see the yellow lines in Figures 1a and 1b). The CISS aims to measure the current state of instability in the financial system as a whole or, equivalently, the level of ‘systemic stress’.1 Systemic stress is interpreted as the amount of systemic risk which has already materialised. The rapid unfolding of events also triggered the need for frequent and regular monitoring of financial fragmentation developments across different market segments, and here rose a challenge because such indicators have long lags.
The ECB has monitored the state of financial integration in the euro area since the launch of the euro, but with a medium-term perspective based on annual and sometimes quarterly data. This type of analysis yields important insights about the functioning of financial markets, which matters, amongst other things, for the smooth and uniform transmission of monetary policy across the euro area. In March 2020, the ECB published a report on “Financial Integration and Structures in the Euro Area”. The report has a cut-off date of end-2019 – in other words, well before the unwinding of the economic and financial effects of the COVID-19 crisis.
Yet, the COVID-19 crisis brought a need to monitor euro area financial integration at a higher frequency. Some of the indicators in the ECB’s March report lent themselves to a high-frequency transformation. This column presents the key features of a novel composite high-frequency, price-based indicator of financial integration, which has just been released in an article in the latest ECB Economic Bulletin (Borgioli et al. 2020). In what follows, we first explain the construction of this indicator and then illustrate its contribution to monitoring financial fragmentation and illustrating the effects of monetary, supervisory and fiscal policy responses, as well as the EU’s institutional reforms.
In order to carefully track the impact of the COVID-19 crisis on financial integration, high-frequency monitoring measures had to be developed. To craft such a toolkit, we mainly focused on the price-based dimension of financial integration, given the instant reaction of prices to incoming news. Cross-border holdings of assets – i.e. the quantity dimension of integration – are of course stickier. The starting point was the monthly price-based composite indicator of financial integration developed by Hoffmann et al. (2019), which aggregates the cross-country dispersion of returns in four market segments – the money market, bond market, equity market and banking market – to produce a synthetic and unique gauge of financial integration. Higher-frequency (daily or weekly) input data are available for all market segments except the banking market. Availing of this input and ensuring the greatest possible consistency between high-frequency and lower-frequency data, an aggregate daily measure of financial integration in the euro area was derived.2 This ‘composite price-based financial integration indicator’ allows us to track the impact of the COVID-19 crisis and related policy announcements on financial integration.
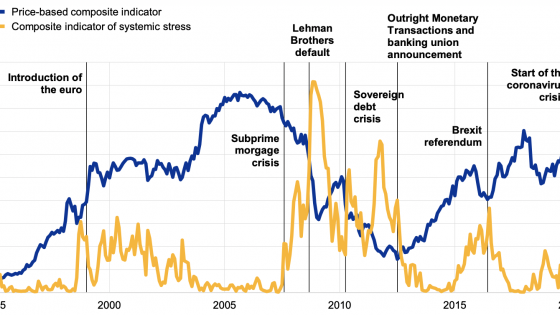
Within weeks of the first reported COVID-19 cases, the indicator fell to levels similar to those observed in the months following the introduction of the euro (see the blue line in Figure 1). The figure brings together the indicators of financial integration and systemic risk in the euro area from two perspectives: an historical one from January 1995 to mid-September 2020, and a zoom in on the COVID-19 crisis from 30 January to 15 September 2020. The historic perspective shows that the drop between February and April 2020 was comparable to the declines experienced at the start of the global financial crisis of 2008 and the euro area sovereign debt crisis in 2010-11, and the drop in March 2020 was the fourth-largest month-on-month drop in the level of this indicator since the launch of the euro. There were concerns about fragmentation among euro area countries (Buti 2020). Both systemic stress and fragmentation in euro area financial markets became acute.
Figure 1 Financial integration and systemic risk in the euro area
a) Historical price-based financial integration and systemic risk from January 1995 to 15 September 2020 (monthly data)
b) Price-based financial integration and systemic risk during the COVID-19 crisis from 30 January to 15 September 2020 (daily data)
Sources: ECB and ECB calculations.
Notes: The price-based composite indicator of financial integration in panel (a) was developed by Hoffmann, P. et al., op. cit., and transformed to give the daily readings shown in panel (b) (see Box 1). For details on the general methodology behind the CISS, see Holló, D., Kremer, M. and Lo Duca, M., “CISS – a composite indicator of systemic stress in the financial system”, Working Paper Series, No 1426, ECB, Frankfurt am Main, March 2012. Both indicators are calibrated to vary between 0 and 1. The shaded areas in panel (b) mark the four phases of the crisis as defined in Table 1.
The events shown as numbered lines in panel (b) of this chart are as follows:
1. First European Council meeting on the European response (10 March)
2. ECB Governing Council meeting (12 March)
3. Second European Council meeting on the European response (17 March)
4. ECB announcement of the PEPP (18 March)
5. PEPP legal documentation published (25 March)
6. Third European Council meeting on the European response (26 March)
7. ECB collateral rating freeze (22 April)
8. Fourth European Council meeting on the European response, with endorsement of the Eurogroup’s comprehensive policy response and plans for a recovery fund (23 April)
9. ECB Governing Council meeting (30 April)
10. Franco-German €500 billion European recovery fund proposal (18 May)
11. European Commission €750 billion “Next Generation EU” recovery instrument proposal (27 May)
12. ECB expansion of the PEPP (4 June)
13. Fifth European Council meeting on the European response (19 June)
14. ECB Governing Council meeting (16 July)
15. Start of special European Council meeting (17-21 July)
16. ECB Governing Council meeting (10 September).
At the same time, one remarkable feature of the COVID-19 crisis has been the rapid rebound of financial integration in recent months. Our indicator helps us identify the key dates and sources of stabilisation. It shows the powerful stabilising effects of monetary and supervisory responses (such as the freezing of collaterals) together with the European fiscal response, which came in two stages: (1) safety nets; and (2) the announcement of, and progress with, Next Generation EU (including temporary joint borrowing).
References
Borgioli, S, C-W Horn, U Kochanska, P Molitor and F P Mongelli (2020), “European financial integration during the COVID-19 crisis”, ECB Economic Bulletin 7, November.
Buti, M (2020), “A tale of two crises: Lessons from the financial crisis to prevent the Great Fragmentation”, VoxEU, 13 July.
ECB (2020), “Financial integration and structure in the euro area” (see also the accompanying Statistical annex).
Guerrieri, V, G Lorenzoni, L Straub and I Werning (2020), “Macroeconomic Implications of COVID-19: Can Negative Supply Shocks Cause Demand Shortages?”, NBER Working Paper 26918.
Hoffmann, P, M Kremer and S Zaharia (2019), “Financial integration in Europe through the lens of composite indicators”, ECB Working Paper No. 2319.
Holló, D, M Kremer and M Lo Duca (2012), “CISS – a composite indicator of systemic stress in the financial system”, ECB Working Paper No. 1426.
Endnotes
1 CISS is an indicator that uses information from equity, bonds, exchange rate volatilities, banks, and payments systems and weights more when the stress has been found in several markets at the same time (Hoffmann et al. 2019).
2 The methodological details of the derivation of the daily composite indicators are provided in Box 1 of Borgioli et al. (2020).


