Foreign direct investment (FDI) statistics are key indicators of international production and of countries’ participation in the global economy. Recently, FDI statistics have been criticised as boundaries between ‘real’ and financial investment have become increasingly blurred (Lipsey 2007, Beugelsdijk et al. 2010, Wacker 2013, Leino and Ali-Yrkko 2014, Blanchard and Acalin 2016).
One of the most contentious issues is the outsized role of financial centres as the middleman between investors’ country of origin and the final destination of the investment (OECD 2009,1 Damgaard and Elkjaer 2017, Borga and Caliandro 2018). Bilateral FDI statistics show only the direct investment links to a destination. Typically, however, 30–50% of investment has been channelled through conduits (UNCTAD 2015, Haberly and Wojcik 2015, Bolwijn et al. 2018) — making the ultimate-investor country invisible and giving rise to the idea of ‘phantom FDI’ (Financial Times 2019).
Tracking ultimate investors is critical to meaningfully grasp real patterns of international production – where investment decisions were taken, where capital originated from, and who bears the risks and reaps the benefits of investments.
My new paper (Casella 2019) proposes an innovative way to determine ultimate investors in bilateral FDI stock. The result is a bilateral matrix that provides FDI positions by ultimate counterparts for over 100 recipient countries, a breakthrough from the past. The availability of a fairly comprehensive picture of ultimate investors opens a range of important analytical and policy applications.
Markov chains to chase ultimate investors
My method assigns a transition rule to link recipient countries to ultimate investors based on the information provided by bilateral FDI statistics and assumptions on conduit FDI. Absorbing Markov chains make it possible to derive the distribution of ultimate investors for any recipient country for which (inward) bilateral FDI stock are available (more than 100 countries, corresponding to over 95% of total FDI stock).
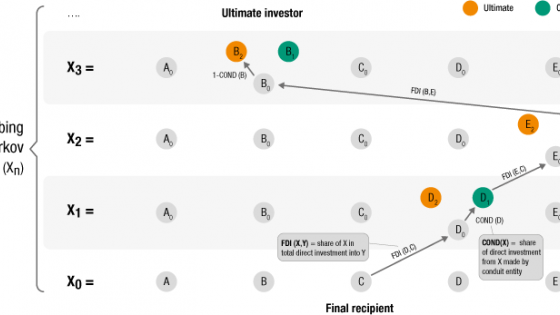
Figure 1 shows how the direct investor in country C, at the start of the chain X0, is country D. This is simply given by the share of D in total inward FDI stock of C (as reported by C inward bilateral statistics).
Figure 1 An absorbing Markov chain to model the investment process.
Note: In the path illustrated in the figure, investors at chain-links X1 and X2 (countries D and E, respectively) are in conduit states (D1 and E1) and the Markov chain thus stops at the third iteration, with country B qualifying as ultimate investor for C.
For each investor, the analytical process then allows two states, a transient state 1, corresponding to a conduit investor (‘D has a further direct investor’), and an absorbing state 2 corresponding to an ultimate investor (‘D has no further direct investor’). The probability that an investor country D is in a transient state D1 is assigned by the implied investment method (Bolwijn et. al 2018), estimating the share of investment from D made by a conduit entity.2 If the chain is in an absorbing state, the process stops, otherwise it iterates, with the same dynamics.
Probabilistic theory (e.g. Stroock 2005) assures that under certain, easily verifiable conditions, the Markov chain will eventually reach an absorbing state. Moreover, it is possible to compute the final distribution of the absorbing states for any initial state X0. That distribution is precisely the distribution by ultimate investors we are looking for.
Results
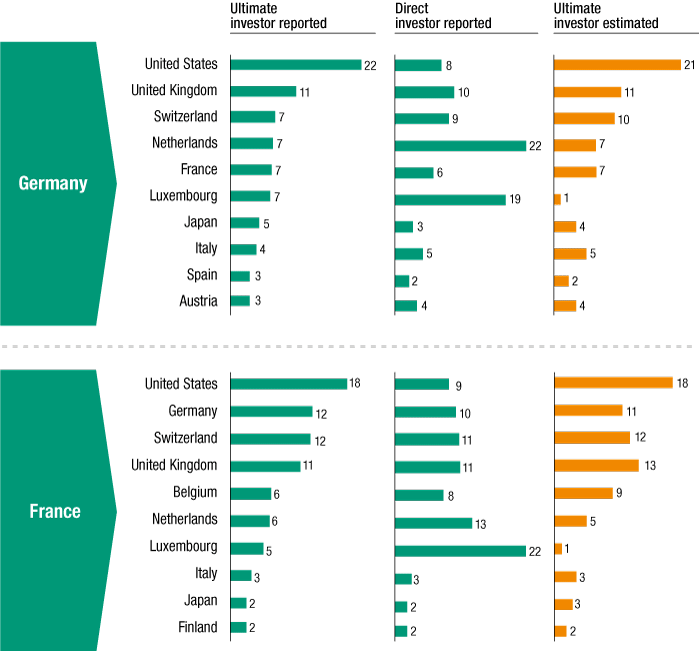
This methodology provides a much more accurate snapshot of ultimate-investor relationships than standard FDI statistics. The case is illustrated in Figure 2 for Germany and France, among the few countries that report FDI positions by ultimate investors. Relative to the distribution of the ultimate investors (column 1), bilateral FDI statistics (column 2) inflate the role of large European investment hubs such as Luxembourg and the Netherlands, while depressing the share of some major investor countries such as the US.
The application of the probabilistic approach in the third column re-establishes a realistic distribution and ranking among investors, more aligned with reported data on ultimate investors and more consistent with the economic size of the investor countries.
Figure 2 Comparison between reported positions by ultimate investors, reported positions by direct investors, and estimated positions by ultimate investors (largest 10 ultimate foreign investors,%).
Note: Reported data on positions by ultimate investors and by direct investors from the OECD (https://stats.oecd.org), December 2018.
For twelve countries reporting statistics on ultimate investors,3 Figure 3 compares the distance between the distribution of bilateral FDI and the reported distribution of ultimate investors, with the distances between the estimated distribution and the reported distribution of the ultimate investors. For all countries, the estimated distribution approximates the reported distribution of ultimate investors more closely than standard bilateral FDI. In eight out of 12 cases, the refinement of the analysis is considerable, with a decrease in total variation distance of over 40%.
Figure 3 Distance from the reported distribution of ultimate investors: bilateral FDI vs probabilistic approach
Note: Reported data on positions by ultimate investors and by direct investors from the OECD (https://stats.oecd.org), December 2018. Distance measured in terms of total variation distance. Countries ranked based on the total variation distance between the reported distribution of ultimate investors and the reported distribution of direct investors.
Implications for economic and policy analysis
A picture of FDI by ultimate investors provides new insights with implications for different areas of economic analysis and policymaking, including trade, development, international taxation, and investment.
Trade: Raising the investment toll of trade tensions
The ultimate-investor perspective can substantially change the FDI value at stake in bilateral tensions. For example, US investment in China increases from 3% of Chinese inward FDI stock, according to official statistics, to around 10%, based on our estimate by ultimate investor. This amplifies the economic consequences of raising tariffs because of the impact on intra-firm trade.4 Recent media articles have focused on the policy implications of scaling up the size of investment in Russia from US and European countries (Brüggmann 2019, Tkachev 2019).
In contrast, in the case of Brexit, the ultimate-investor view appears to reduce the FDI burden of the UK’s exit from the European Union. By limiting the size of European conduit jurisdictions (primarily the Netherlands and Luxembourg), the ultimate-investor view puts the share of the EU as an investor in the UK at 32%, lower than the 41% indicated by standard bilateral FDI.
Development: A more nuanced assessment of South-South FDI and regional integration
Although the rise of investment in developing economies from other developing economies is an important trend in the global investment landscape, FDI estimates by ultimate investors reveal that this phenomenon is as yet relatively small. Investments channelled through regional gateway jurisdictions are often owned by ultimate investors based in the developed world. The share of South-South investment in total investment to developing economies plummets from almost 50% (when measured based on standard FDI data) to 28% when based on ultimate investors. Similarly, the share of intra-regional FDI in developing economies declines from 36% to 24% (UNCTAD 2019: 29-30).
International taxation: Adding the home-country perspective
The most important, although not unique, motivation of conduit FDI is fiscal optimisation of multinational enterprises. Studies on the link between FDI and tax avoidance (Bolwijn et al. 2018, Jansky and Palansky 2018) focus on the relationship between conduit jurisdictions and recipient countries and tend to overlook the role of home countries, partly due to a lack of data connecting conduit FDI to home countries. The view by ultimate investors adds the home-country perspective to the puzzle of international taxation and investment.
Investment policy: Better data, more effective policies
National strategies to attract foreign investment—and the activities of investment promotion agencies—should rely on a comprehensive view of the investment network in which countries are embedded. Such a view should go beyond the first layer of immediate investors or recipients and look at where investment decisions are made.
Also, academic research exploring strategies for attracting FDI has traditionally been grounded in econometric literature on FDI drivers and determinants using standard bilateral FDI as the empirical basis for gravity-type equations. Employing bilateral links based on ultimate investors may lead to better inputs into investment policymaking.
Author’s note: The views expressed in this column are solely those of the author and do not necessarily represent the view of the United Nations.
References
Beugelsdijk, S, J-F Hennart, A Slangen and R Smeets (2010), “Why and how FDI stocks are a biased measure of MNE affiliate activity”, Journal of International Business Studies 41(9): 1444–59.
Blanchard, O, and J Acalin (2016), “What does measured FDI actually measure?”, Policy Briefs PB16-17, Peterson Institute for International Economics.
Bolwijn, R, B Casella and D Rigo (2018), “An FDI-driven approach to measuring the scale and economic impact of BEPS”, Transnational Corporations 25(2): 107–43.
Borga, M, and C Caliandro (2018), “Eliminating the pass-through: Towards FDI statistics that better capture the financial and economic linkages between countries”, in The Challenges of Globalization in the Measurement of National Accounts, NBER Chapters, National Bureau of Economic Research.
Brüggmann, M (2019), “USA wollen Russland sanktionieren – und sind doch größter Investor”, Handelsblatt.com, 12 September).
Casella, B (2019), “Looking through conduit FDI in search of ultimate investors – a probabilistic approach”, Transnational Corporations 26(1): 109–46.
Damgaard, J, and T Elkjaer (2017), “The global FDI network: searching for ultimate investors”, Technical Report 17/258, IMF Working Paper.
Financial Times (2019), “Phantom investment calls for exorcism”, FT.com, 10 September.
Haberly, D, and D Wojcik (2015), “Regional blocks and imperial legacies: mapping the global offshore FDI network”, Economic Geography 91(3): 251–80.
Jansky, P, and M Palansky (2018), “Estimating the scale of profit shifting and tax revenue losses related to foreign direct investment”, WIDER Working Paper Series 021, World Institute for Development Economics Research (UNU-WIDER).
Leino, T, and J Ali-Yrkko (2014), “How does foreign direct investment measure real investment by foreign-owned companies? Firm-level analysis”, ETLA Reports 27, The Research Institute of the Finnish Economy.
Lipsey, R E (2007), “Defining and measuring the location of FDI output”, NBER Working Paper 12996.
Stroock, D V (2005), An introduction to Markov processes, Springer-Verlag Berlin Heidelberg.
Tkachev, I (2019), “A quiet revolution in the analysis of foreign investment”, Riddle, 2 August.
UNCTAD (2015), World investment report 2015: Reforming the international investment governance, United Nations.
UNCTAD (2019), World investment report 2019: special economic zones, United Nations.
Wacker, K M (2013), “On the measurement of foreign direct investment and its relationship to activities of multinational corporations”, Working Paper Series 1614, European Central Bank.
Endnotes
[1] The 2008 OECD Benchmark Definition of Foreign Direct Investment states that “it is strongly encouraged that supplemental inward FDI positions be compiled on an ultimate investing country (UIC) basis” (p. 110). Nevertheless, progress in the reporting of positions based on ultimate investors has been slow. By 2016 data, only 14 OECD countries reported FDI stock by ultimate investors.
[2] The implied investment method combines reported information on FDI through Special Purpose Entities, available for a subset of countries, and estimates of the conduit shares based on the excess FDI compared to the economic size of an economy. An alternative approach to sizing conduit FDI is proposed by Damgaard and Elkjaer (2017), also linking the presence of conduit investment to the relative size of FDI. Results of the two methods are generally aligned. However, as argued in Casella (2019: 136–7), more systematic comparison is desirable, including also the method proposed by Borga and Caliandro (2018) to estimate conduit FDI through operational (non-Special Purpose Entities) entities.
[3] I selected the 12 countries that have reported data on ultimate investors for at least three years, as of 2016.
[4] Intra-firm trade corresponds to around a third of global trade, according to UNCTAD estimate (UNCTAD 2015: 135).


