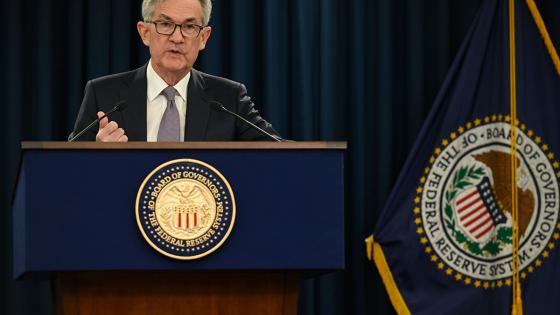
During his recent speech at the annual Jackson Hole Economic Symposium organised by the Federal Reserve Bank of Kansas City, Federal Reserve Chairman Jerome Powell unveiled a new policy framework (Powell 2020). The revised strategy represents an important improvement over the existing one. Its most notable feature is the introduction of ‘average inflation targeting’ – the Federal Reserve is now committed to keeping average inflation at 2% over time.
Concretely, this means that if inflation is temporarily below 2% – the Federal Reserve’s target – the central bank commits to letting it mildly overshoot in the future, so that on average inflation evens out at 2%.
The new announcement is a significant departure from the existing policy framework. During the financial crisis of 2007-08, for example, inflation persistently ran below target. However, it was generally assumed – and priced in accordingly by the markets – that the Fed was only aiming at having inflation recover gradually back to its 2% target. To the best of our knowledge, nobody was expecting the central bank to deliberately overshoot its target as the economy started growing again, so that inflation would average 2% over a longer time horizon. Yet, this is exactly what Chairman Powell is proposing as the new rule of the road going forward. The current framework thus resembles much more closely a policy of price-level targeting in the presence of trend inflation, where a deviation of the price level below its trend will be met with vigorous monetary expansions as the price level catches up to the target trend. However, this may require inflation to be temporarily higher than the 2% target. Thus, it resembles closely a targeting rule proposed by Eggertsson and Woodford (2003).
In a recent paper (Eggertsson et al. 2020), we illustrate what this means in practice in the context of the publicly available DSGE model constructed by the Federal Reserve Bank of New York. Our results suggest that had the Fed adopted the new policy framework going into the crisis of 2008 – and had the market formed its expectations accordingly – then the resulting contraction in output would have been 25% smaller relative to trend.
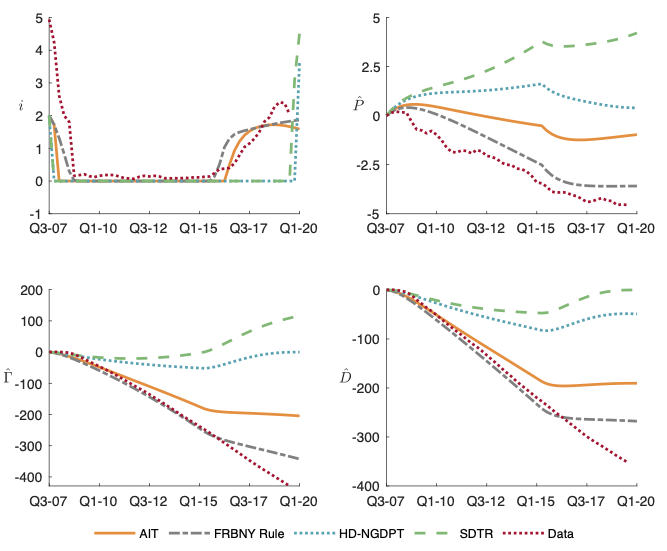
The logic behind the result is simple: inflation – measured by growth in the core-PCE price index – fell modestly below the 2% target during the crisis of 2008. As the economy recovered, however, the Federal Reserve initiated a rate hike before inflation rose above the 2% target in 2015. The Fed only wanted current inflation to hit its target, but had no intention of allowing it to overshoot, so that inflation would have averaged 2% once past misses were taken into account. Had the central bank followed the current policy framework, however, it would not have raised rates as quickly, and would have welcomed a temporary overshoot of inflation. According to our simulations, under this new policy the Fed would not have raised rates in 2015-Q4 as it did at the time, but instead would have waited until the third quarter of 2016, as shown in the top-left panel of Figure 1. Moreover, it would have allowed inflation to overshoot its target by a modest amount, thus ensuring that inflation would have averaged 2% once the recession and recovery period were bundled together. The top-right quadrant of Figure 1 reports the evolution of the price level in deviation from a trend of 2% constant growth in prices. As we can see from the red dots, the Federal Reserve started raising rates before prices were anywhere close to this trend. By contrast, under average inflation targeting (AIT), rates start rising only after the price level approaches trend.
But why does this help? The reason is that markets are forward-looking – during a crisis period like 2008, under the new policy framework private-sector agents would have anticipated an extended monetary policy stimulus as the economy embarked on a recovery. The expectation of a more sustained intervention would have reduced the economic contraction in the first place, much like regular interest rate cuts, which were not available in 2008 once rates had reached zero.
While the new policy framework is certainly an important innovation, it is worth asking: could it be improved further? In our analysis we identify an important limitation: average inflation targeting unsurprisingly only prescribes a make-up strategy based upon inflation falling below its target. This may seem trivial until one realises there is no similar stipulation for the second part of the Fed’s dual mandate, generally believed to be full employment.
Figure 1 Dynamic response to a cost push shock in the FRBNY DSGE model, under different policy strategies
Notes: The top-left panel represents the nominal interest rate. The top-right panel shows the price level. The bottom panels represent targeting criteria for HD-NGDPT (left) and SDTR (right). Monetary policy rules: AIT (solid orange) = Average Inflation Targeting; FRBNY Rule (dash-dot black) = modified Taylor rule from FRBNY DSGE model; HD-NGDPT (dot blue) = History-Dependent Nominal GDP Target; SDTR (dash green) = Symmetric Dual-Objective Targeting Rule; The dotted red line represents the data. The crisis state starts in 2007-Q4 and reverts after 32 quarters. The vertical axes for the top-right panel reports percent deviations from its trend. The vertical axes for the bottom panels report deviations from initial levels (2007-Q3 = 0). The vertical axis for the top-left panel reports annualised percentage points. The horizontal axes shows quarter and calendar year.
Let us explain why this matters by considering the following scenario. Suppose there is a large demand shock that requires a monetary stimulus sizeable enough so that the policy rate collapses to zero, without any room for further cuts. This is precisely the type of scenario that the new framework is designed to guard against. Typically, with a fall in output, there is also a drop in inflation. Despite interest rates collapsing to zero, the new policy framework then (1) signals low interest rates for an extended period, thus compensating for the Fed’s inability to cut rates; and (2) provides a stronger signal the larger the fall in inflation. But imagine now that in addition to a large demand shock – which suppresses output and inflation – there is also a negative supply shock, that adds upward pressure on inflation. Assume that this ‘cost-push’ shock is strong enough to prevent any fall in price growth. In this case, the signal of a future monetary stimulus, usually essential when interest rates hit zero, is choked by the supply shock, even though it may be desperately needed.
With the current Federal Funds rate at zero and record unemployment, there are some indications that the situation described above may correspond to the one the Federal Reserve finds itself in today. Despite all the slack, there has been little downward pressure on inflation; a natural reason for this might be that the economic shock generated by the COVID-19 pandemic corresponds not only to a demand contraction, but also to a simultaneous supply shock. One could even argue that the same applied during the Great Recession, for there was very little fall in inflation at the time despite a significant drop in output and a sharp rise in unemployment (perhaps due to oil supply disruptions around the same time which created upward pressures on prices). As shown in Figure 1, the price level dropped only by about 5% relative to trend. While the simulation results we describe above suggest that the new policy stance would have mitigated the output contraction in the Great Recession by 25%, one question remains: could more have been done?
An alternative policy regime that overcomes the problem introduced above is the Federal Reserve targeting an index that incorporates both elements of its dual mandate – namely, the price level and output. One such index is simply nominal GDP, which is defined as the dollar value of production in the US. Suppose the Federal Reserve were to target average nominal output relative to its trend over time. In this case, if nominal GDP is below trend the Federal Reserve commits to overshooting in the future, so that on average the nominal GDP target is met. If an economic contraction occurs with no drop in inflation, this policy regime prescribes a substantial monetary stimulus at the zero lower bound due to the fall in real output. This makes the strategy more robust than policy frameworks, such as average inflation targeting, that rely on a fall in inflation. In Eggertsson et al. (2020) we call this policy a history-dependent nominal GDP target (HD-NGDPT). Had the Fed adopted a policy regime of this kind in 2008 – and provided it was widely believed by the market – approximately 80% of the contraction in output would have been eliminated. The reason is that this policy would have committed to a substantial monetary easing, prescribing a lift-off from the zero lower bound only in the last quarter of 2019, as show the top-left panel of Figure 1. This is in stark contrast to the newly adopted average inflation targeting of the Federal Reserve, which in our simulations would have started raising rates already in mid-2016. As shown in the bottom-left panel of Figure 1, the reason for this delayed increase in rates is that the threshold for lift-off is not just average inflation, but instead a measure of average deviation of nominal GDP from trend.
In Eggertsson et al. (2020) we also illustrate an alternative policy regime we term the symmetric dual-objective targeting rule. Instead of misses of nominal GDP alone, this strategy points the central bank to shortfalls in inflation and real output.1 If the central bank misses these targets – for example, due to the zero lower bound – it commits to make up for its mistakes in the future, much as average inflation targeting that has now been adopted. According to this policy regime, however, the Fed also takes account of shortfalls in output. This policy regime results in relatively similar outcomes to HD-NGDPT, and is also illustrated in Figure 1.
One attractive feature of average inflation targeting is that is formulated in terms of a widely understood economic object, namely the evolution of inflation. Thus, in order to communicate them the central bank need not state any specific time frame in which the zero lower bound will be binding in the future. Instead, the market will take care of the forecasting job. The same can be said for both policy regimes we introduce above; the only additional feature is the presence of some measure of aggregate activity, but these measures are also generally well understood by markets.
Overall, the new policy regime adopted by the Federal Reserve represents an important improvement relative to the existing framework. What we argue above, however, is that this strategy can be potentially improved even further. Since both our proposals are centred around the additional incorporation of the output-employment mandate of the Federal Reserve, we believe these innovations are squarely within the current dual mandate. Indeed, as we show in Eggertsson et al. (2020), our alternative policy regimes do a better job in achieving the Fed’s dual mandate2 than the current framework.
References
Eggertsson, G B and M Woodford (2003), “The Zero Bound on Interest Rates and Optimal Monetary Policy”, Brookings Papers on Economic Activity 2003(1): 139–233.
Eggertsson, G B, S K Egiev, A Lin, J Platzer, and L Riva (2020), “A Toolkit for Solving Models with a Lower Bound on Interest Rates of Stochastic Duration”, Working paper.
Powell, J (2020), “New Economic Challenges And The Fed’s Monetary Policy Review”, speech at “Navigating The Decade Ahead: Implications For Monetary Policy”, an Economic Policy Symposium Sponsored By The Federal Reserve Bank Of Kansas City, Jackson Hole.
Endnotes
1 The cumulated shortfall is represented in the bottom-right quadrant of Figure 1.
2 Approximated by quadratic deviations of inflation from target and output from potential.


