Why are some countries so much richer than others? In search for an explanation, economists have learned over the past years that a key difference between more and less developed countries, a symptom of the development disease, lies in the speed at which the average business grows over its life cycle in each country (Hsieh and Klenow 2014, Caunedo and Yurdagul 2018). The fact was first uncovered by Hsieh and Klenow (2014), who showed that employment growth from birth at a firm in the US is several-fold that observed in Mexico or India.1 It is replicated for Colombia versus the US (Figure 1).
Figure 1 Employment over the life cycle of manufacturing plants, Colombia vs the US, 2002-2012
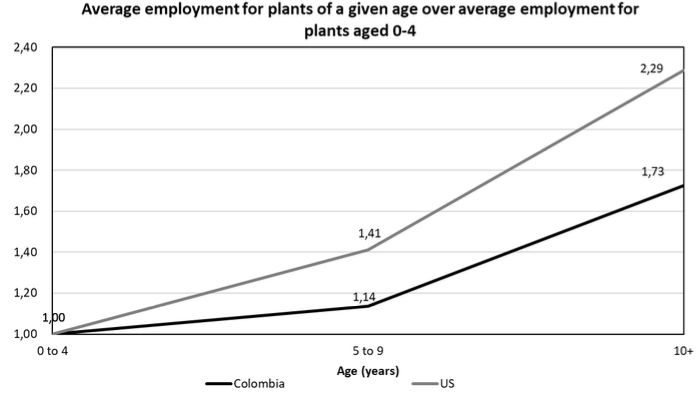
Source: Eslava et al. (2019).
However, the distribution of employment growth within the US exhibits great variation across businesses and is also skewed – it is the fastest growing businesses that drive average growth, while most firms either do not grow or contract (Haltiwanger et al. 2013). To what extent, then, are the differences in life cycle employment dynamics between high- and lower-income countries also driven by differences in the upper and lower tails of the respective distribution, more than median growth? The answer to this question has important implications, for example, for the design of public policy aimed at fostering firm growth.
Comparing Colombia and the US
By comparing manufacturing establishments in Colombia and the US, in a recent paper (Eslava et al. 2019) we conclude that average life cycle growth differences across countries with diverging income levels are, to a large extent, in fact, driven by the tails of the growth and size distribution (i.e. the superstars and the worst performers, the largest and the smallest). This is especially true at early stages of the life of a business, when it is most likely that businesses either grow fast or exit.
The availability of broadly comparable data on employment growth for much of the distribution of manufacturing businesses in Colombia and the US explains our focus on these countries and sectors. Although Colombia is clearly not one of the poorest countries in the world, it does exhibit a huge income and productivity gap compared to the US – it takes a work-week for a worker in a Colombian firm to produce the same value that a worker at a US firm produces in just one day. To that extent, our comparison should shed light on the differences in the distribution of life cycle growth across development levels.
Similarities in employment growth
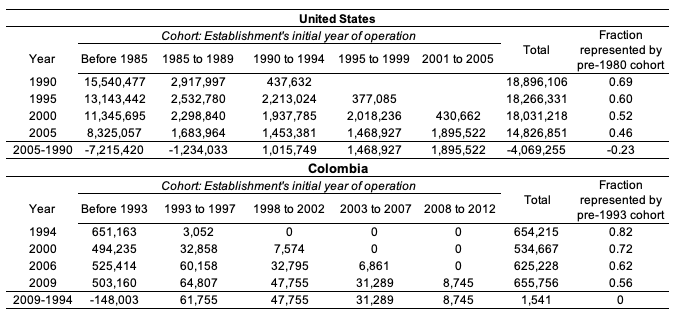
In many respects, surprisingly, the distribution of employment growth across establishments exhibits quite similar patterns in the two countries.2 First, while the typical (median) establishment neither grows nor contracts between one year and the next, there is wide variation, with the fastest growing plants expanding at an impressive inter-annual rate and the slowest ones contracting (Figure 2). Second, young businesses grow much faster on average than older ones, and exhibit a higher likelihood of exiting and destroying jobs, a fact that had already been uncovered for the US by Haltiwanger et al. (2013) and that we find is replicated in Colombia (Figure 3). Third, while recently born establishments represent a tiny fraction of total employment in any year, the birth of new establishments is crucial for overall employment growth over the medium run (Table 1).
Figure 2 Distribution of employment growth rates for continuers, Colombia 1982-2012 vs US 1992-2012
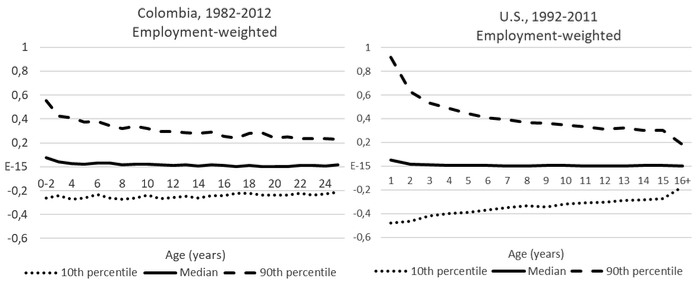
Source: Eslava et al. (2019).
Figure 3 Employment growth rates for continuers and exit rate by age and growth, Colombia vs US, 1992-2012
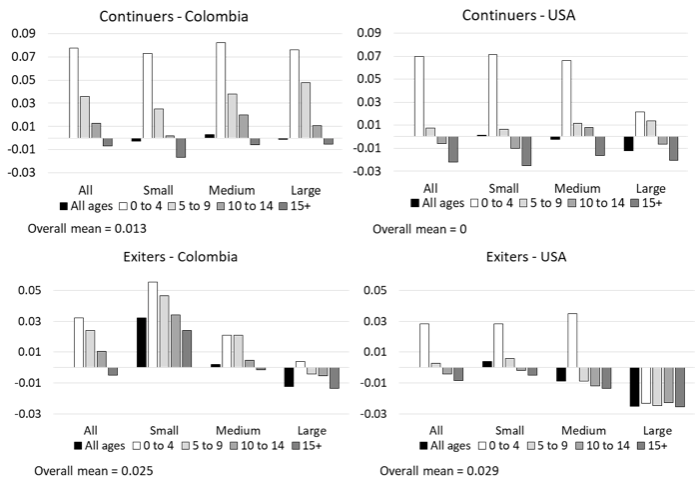
Source: Eslava et al. (2019).
Notes: Upper panel: employment-weighted average 2(Lit– Lit–1)/(Lit+ Lit–1). Lower panel: employment-weighted average of exit rates. All bars are deviated from overall mean. Size categories: small: L < 50; medium: 50 ≤ L < 250; large: L ≥ 250.
Table 1 Total employment by cohort
Source: Eslava et al. (2019).
Similarities masking the differences
However, these broad similarities hide sharp contrasts at both ends of the distribution of growth and size that (in an accounting sense) explain why, in spite of such similarities, average life cycle growth is still lower in Colombia. As Figure 2 shows, the dispersion and skewness of annual growth rates, while large in both countries, is more marked in the US than Colombia. This is especially true for young ages, which is the age range where growth is more dynamic. In the upper tail of the distribution, the Colombian 90th percentile young business does not exhibit the spectacular growth that young superstars display in the US. The 90-50th and 90-10th ranges in the US almost double those in Colombia for ages one to five. At the same time, the 10th percentile of growth contracts more decidedly in the US than Colombia, and the ratio of exits in young plants to exits in older ones is larger in the US (Figure 3).
These differential patterns of growth imply that in Colombia small plants are more likely to survive to old ages without significantly growing in size. While in Colombia around 65% of 10-49 employee plants are aged at least 16 years, in the US the fraction is less than 50% (Table 2).
Table 2 Manufacturing establishments size-age distribution, employment-weighted, 2005
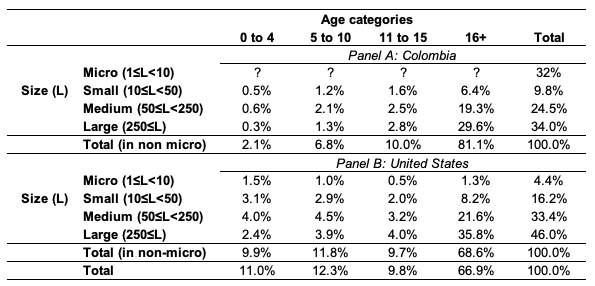
Source: Eslava et al. (2019).
The prevalence of microestablishments
The size distribution of plants also reveals another outstanding feature of the tails of the Colombian business population relative to the US: the vast prevalence of microestablishments (defined here as those with fewer than ten employees). While in the US only 4% of manufacturing employment works at establishments of fewer than ten employees, these tiny establishments absorb 32% of Colombian manufacturing establishments. Microestablishments also account for less in the US than Colombia in terms of numbers of establishments (50% versus 87%). A vast share of microestablishments in employment and in the population of plants has also been recently documented for Mexico (Levy 2018).
Relative to the US, then, Colombia presents an overwhelming prevalence of microestablishments, a deficit of superstar plants, and less strict market selection pressure for underperforming plants. The picture that emerges suggests that lower average growth in Colombia relative to the US partly arises from an environment in the former that de-incentivises extraordinary growth while allowing poor performers to remain in the market even without growing. Recent results in Eslava and Haltiwanger (2019) provide supporting evidence that this is the case. While there is dispersion in employment, output, and sales growth across plants, the degree of variation in these dimensions is greatly muted in comparison to dispersion in underlying productivity, defined as the value produced by unit of input (Figure 4).
Figure 4 Sales growth: Actual vs predicted by productivity growth
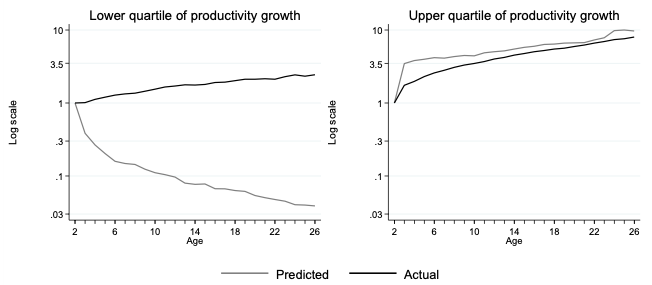
Source: Eslava and Haltiwanger (2019).
Policy implications
If these are the main symptoms of Colombia’s anaemic productivity growth, and likely those of similar countries, the policy response must address plausible reasons behind these symptoms. They suggest, primarily, that a business’ success in Colombia is not sufficiently linked to its efforts to improve productivity – underperforming businesses survive and extraordinary productivity growth is not sufficiently rewarded with extraordinary income growth, and therefore is de-incentivised.
Examples of such perverse incentives abound in Colombia, including stimulus to entrepreneurship that disregard a business’ growth potential, high costs for formality and close to inexistent penalties for informality, regulatory excess coupled with an enforcement capability that is at the same time weak and focused on formal businesses, benefits conditional on firms being small, and again disregarding growth potential. Simultaneously, there is poor provision of the public goods that are necessary for business growth such as efficient public administration (including simple but enforced regulation), infrastructure, expedite justice, strong consumer protection, and quality certification.
As in many other countries, public policy for growth in Colombia focuses on the implementation of active innovation policy initiatives and public business services (e.g. training programmes to improve managerial capabilities, organisation of international business fairs, and public credit for innovation). These active policies may help alleviate some of the symptoms of the country’s anaemic productivity growth. However, they reach a limited population of beneficiaries and, in the context of the prevailing adverse business environment, face the danger of fostering even more underperforming entrepreneurship.
Editors' note: This column also appeared on VoxDev.
References
Caunedo, J and E Yurdagul (2019), “Who quits next? Firm growth in growing economies”, Economic Inquiry 57(1): 33-49.
Eslava, M and J Haltiwanger (2019), “The life-cycle growth of plants: The role of productivity, demand and wedges”, mimeo, Universidad de los Andes.
Eslava, M, J Haltiwanger and A Pinzón (2019), “Job creation in Colombia vs. the US: ‘up or out dynamics’ meets ‘the life cycle of plants’”, NBER Working Paper 25550.
Haltiwanger, J, R Jarmin and J Miranda (2013), “Who creates jobs? Small versus large versus young”, Review of Economics and Statistics 95(2): 347-361.
Hsieh, C and P Klenow (2014), “The life cycle of plants in India and Mexico”, The Quarterly Journal of Economics 129(3): 1035-1084.
Levy, S (2018), “Under-rewarded efforts: The elusive quest for prosperity in Mexico”, Inter-American Development Bank.
Endnotes
[1] Caunedo and Yurdagul (2018) also show that it is, in fact, firm productivity growth over the life cycle, rather than employment growth, that is most closely tied to aggregate GDP growth. At the firm, employment may not follow productivity closely if, for instance, institutions incentivise employment growth even for low productivity firms.
[2] Growth patterns in all figures but Figure 3 consider only establishments with at least ten workers (non-micro establishments) due to data availability constraints.


