Measuring firm innovation is challenging. Many existing approaches focus on measuring inputs to innovation (for example R&D expenditures) or proxies for the output of innovation (for example patents), but such measures may capture only a fraction of firm innovative activity. Building on work by Gort and Klepper (1982), we cast a wider net in our search for innovative activities using patterns in entry and productivity as our guide. Gort and Klepper hypothesise stages of firm dynamics in response to technological innovation that we summarise as innovation yielding a surge in entry, which is followed by a period of significant experimentation and then a shakeout period when successful developers and implementers grow while unsuccessful firms contract and exit.
In Foster et al. (2018), we use specific patterns in measurable economic activity (entry and productivity) to indicate the potential presence of innovative activity. Our analogy is to astronomers searching for black holes indirectly through their impact on nearby visible stars whose properties act according to known laws of nature. While economics does not have laws of nature, we can use its organising principles about the behaviour of economic agents to direct our attention to areas of the economy where innovation is likely to have occurred.
Thus, we re-cast Gort and Klepper’s firm dynamics in the following manner. Innovation leads to entry, which in turn leads to rising productivity dispersion (during the experimentation period) and rising productivity growth (during the consolidation period). This process leads to a period of productivity growth from both within-firm productivity growth (at successful innovators) and productivity-enhancing reallocation dynamics (as resources flow towards successful developers and adopters). The latter may reduce productivity dispersion both through selection and the maturing of the more successful firms.
In some sense, all business entry represents an innovation. However, there are varying degrees of innovation – some new businesses produce completely new products or services, some are new to a particular market, and some are new to a specific location. Gort and Klepper focus on transformational innovations producing new products as drivers of a burst of entry (rather than incremental innovations). Hurst and Pugsley (2011, 2017) emphasise that non-pecuniary benefits play an important role in the occupational decision to become an entrepreneur. Entry of this type of business could lead to productivity dispersion but would be less likely to lead to productivity growth.
We use firm-level data for the US economy from the Longitudinal Business Database.1 We define entry as a new firm entity with all new establishments. Our firm-level measure of labour productivity (hereafter, “productivity”) is the log of the ratio of real revenue to employment. We compute key moments at the four-digit industry (NAICS) by year level. First, we compute the entry rate as the share of new firms relative to all firms in each industry by year cell. Our dispersion measure is the interquartile range (IQR) of productivity within an industry in a given year. Our measure of within-industry productivity growth is the log first difference of real revenue per worker at the industry level.
To explore the dynamic relationship between entry, productivity dispersion, and productivity growth, we use a panel regression using a difference-in-difference specification with period effects and industry effects. We estimate the impact of entry on productivity (both dispersion and growth) for ‘high-tech’ and ‘non-tech’ industries.2 To abstract from business cycle considerations, we use three-year non-overlapping periods to conduct our analysis. We let the impact of entry have a distributed lag form over two three-year sub-periods encompassing a total of six years.
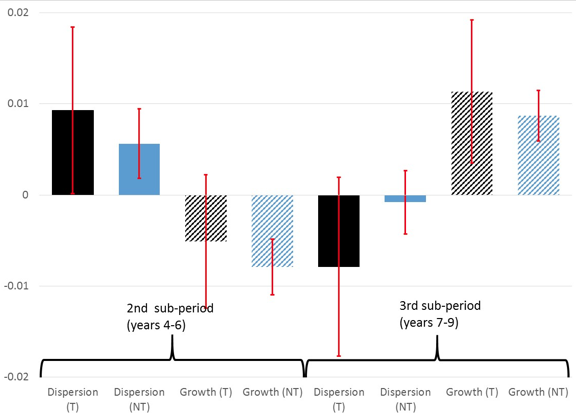
We summarise the main results in Figure 1. We find that an increase in entry in one sub-period (“Years 1-3”) leads to a significant increase in productivity dispersion in the next sub-period (solid bars in “Years 4-6”). Moreover, this effect is larger in the high-tech sector (black bar) as compared to the non-tech sector (blue bar). The fact that the coefficients on the second lag (that is, the third sub-period “Years 7-9”) are not significant suggests this effect at least diminishes over time. Our interpretation is that there is an increase in productivity dispersion following an innovation (as proxied by the entry rate), representing the experimentation and differential success in the development and adoption of innovations.
Figure 1 Changes in productivity dispersion and growth from a 1% (one time) increase in entry rate in first sub-period (years 1-3)
Source: Authors tabulations from estimated coefficients (and see Figure 4 of our paper, which presents an earlier version). The left side of the chart represents one sub-period after entry (years 4-6); the right side represents two sub-periods after entry (years 7-9). High tech (T) results are in black, non-tech (NT) are in blue. Solid bars show results for productivity dispersion, hashed bars show results for productivity growth. The red ‘whiskers’ show approximate 95% confidence intervals. Thus, the first black bar shows the change in 3-year-average productivity dispersion after a 1% increase in the 3-year-average entry rate for High-tech. All other bars are analogous.
The analogous results from the productivity growth specification are shown in hashed bars. Here an increase in the startup rate results in a decrease in productivity growth in the next sub-period (Years 4-6), although this effect is only statistically significant in non-tech. This provides some evidence that the period of experimentation can yield an initial drag on productivity growth. We see an increase in productivity growth in the subsequent periods only (Years 7-9). The productivity growth impact is larger for firms in high-tech industries as compared to firms in non-tech industries.
It is instructive to consider these results in light of the aggregate productivity surge in the US in the 1990s and the subsequent productivity slowdown. While non-tech shows a gradual decline over 1997-2013 in start-ups, high-tech shows a humped shape pattern with a surge in start-ups in the late 1990s before dropping back down (see Figure 1 in Foster et al. 2018). Aggregate productivity growth rises sharply rising in the 1990s in high-tech (see Figure 3 in our paper) but falls noticeably post-2000 confirming earlier studies (Fernald 2014). In contrast, non-tech has much more muted patterns, rising slightly in the 1990s and falling post-2000. Within industry, dispersion of productivity (Figure 2 in our paper) rises in both high-tech and non-tech over the 1990s and post-2000 period.
These patterns line up nicely with Gort and Klepper’s hypothesis (and our findings in Figure 1 above) during the aggregate productivity surge, but less so during the aggregate productivity slump. In high-tech, we observe a rise in entry, a rise in productivity dispersion, and a rise in aggregate productivity in the 1990s. While the timing is not exactly consistent with Figure 1, these 1990s patterns are broadly consistent with Gort and Klepper’s hypothesised dynamics. However, post-2000 we observe a decline in entry and aggregate productivity but a continued and even sharper rise in within-industry productivity dispersion. From Gort and Klepper’s perspective, we should have observed a decline in productivity dispersion.
Thus, some aspects of our results provide micro-level evidence for the hypothesis that the productivity slowdown is due to a decreased pace of innovation and technological change (see Gordon 2016 and Byrne et al. 2013). However, the rising within-industry dispersion in the post-2000 period suggests other factors are also at work. Decker et al.(2018) argue the rising dispersion of productivity is consistent with a rise in adjustment frictions and helps explain the declines in aggregate productivity and reallocation pace post-2000.
We hope to build upon this indirect ‘searching for black holes’ approach to measuring innovation to help better understand the connection between innovation and productivity dispersion and productivity growth. Our results suggest this approach can provide complementary information to more traditional approaches.
Authors’ note: John Haltiwanger was a part-time Schedule A employee of the Census Bureau at the time of the writing of this column. Any opinions and conclusions expressed herein are those of the authors and do not necessarily represent the views of the U.S. Census Bureau. All results have been reviewed to ensure that no confidential information is disclosed.
References
Byrne, D, S Oliner, and D Sichel (2013), “Is the Information Technology Revolution Over?”, International Productivity Monitor 25, Spring.
Decker, R, J Haltiwanger, R S Jarmin, and J Miranda (2018), “Changing Business Dynamism: Shocks vs. Responsiveness”, NBER Working Paper 24236.
Fernald, J (2014), “Productivity and Potential Output Before, During, and after the Great Recession” NBER Macroeconomics Annual 29: 1-51.
Foster, L, C Grim, J Haltiwanger, and Z Wolf (2018), “Innovation, Productivity Dispersion, and Productivity Growth”, NBER Working Paper 24420.
Gordon, R (2016), “Perspectives on the Rise and Fall of American Growth”, American Economic Review Papers and Proceedings 106(5): 72-76.
Gort, M, and S Klepper (1982), “Time Paths in the Diffusion of Product Innovations”, The Economic Journal 92(367): 630-653.
Haltiwanger, J, R S Jarmin, R Kulick, and J Miranda (2017), “High Growth Young Firms: Contribution to Job, Output and Productivity Growth” in Measuring Entrepreneurial Businesses: Current Knowledge and Challenges, NBER/CRIW Conference Volume, University of Chicago Press.
Hecker, D E (2005), “High-technology employment: a NAICS-based update”, Monthly Labor Review 128: 57.
Hurst, E, and B Pugsley (2011), “What Do Small Businesses Do?”, Brookings Papers on Economic Activity 43(2); 73-142.
Hurst, E, and B Pugsley (2017), “Wealth, Tastes, and Entrepreneurial Choice,” in Measuring Entrepreneurial Businesses: Current Knowledge and Challenges, NBER/CRIW Conference Volume, University of Chicago Press.
Endnotes
[1] The Longitudinal Business Database is an economy-wide establishment-level database that covers the universe of employer businesses in the non-farm business sector of the U.S. (about 7 million establishments and 6 million firm observations per year for 1976-2013). We use a newly developed economy-wide firm-level database on productivity (Haltiwanger, Jarmin, Kulick and Miranda (2017)).
[2] We adopt the strategy of Decker et al. (2018) who follow Hecker (2005) in defining High-techindustries as the Science, Technology, Engineering, and Math (STEM) intensive industries.


