Covid-19 is placing enormous stresses not only on countries’ health systems and economies, but also on their public finances (Baldwin and Weder di Mauro 2020). These latter pressures stem from a combination of the contraction in economic activity due to social distancing restrictions and the policy measures introduced by governments to mitigate their impact on individuals and firms (Hughes 2020).
These pressures grow the longer restrictions are in place, raising the question of how long governments can financially sustain both the lockdown and current levels of financial support. This question has become all the more acute in light of recent warnings from public health experts in the UK about the long lead times require to develop a successful vaccine and the likelihood of some social distancing restrictions staying in place for the remainder of the year.1 Drawing on three scenarios for the UK economy described in our earlier Vox column (Leslie et al. 2020), which assume social distancing measures are in place for 3, 6 or 12 months, this column looks at the pressures that coronavirus could put on the UK’s public finances.
Impact on revenue and spending
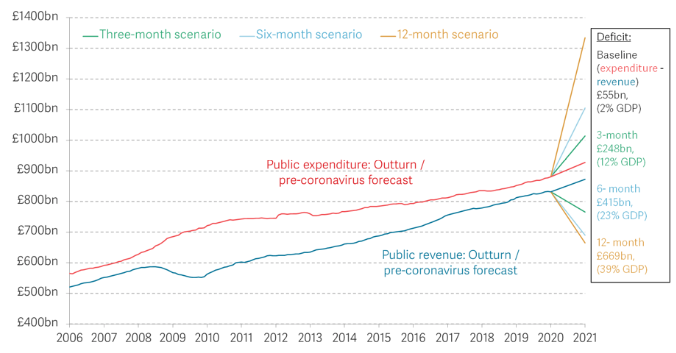
As illustrated in Figure 1, the fiscal costs of coronavirus under the three scenarios derive from a combination of:
- Lower revenues due to the reduction in economic activity during lockdown, a fall-off in tax compliance, and tax reliefs and payment holidays granted by government. These drag total receipts down by over £100 billion in the 3-month scenario to over £200 billion in the 12-month scenario.
- Higher expenditure due to a spike in healthcare costs, higher claims for more generous unemployment and housing benefits, wage subsidies for furloughed employees and the self-employed, defaults on government-guaranteed loans, and financial support extended to particular sectors or firms. These drive total expenditure up by over £85 billion in the 3-month scenario and over £400 billion in the 12-month scenario.
Figure 1 UK public expenditure and revenue under 3, 6 and 12-month lockdowns (£ billion)
Notes: Includes all policy announcements to 16 April 2020.
Source: Resolution Foundation analysis of OBR, Economic and Fiscal Outlook – March 2020, ONS, Public sector finances.
Impact on government borrowing
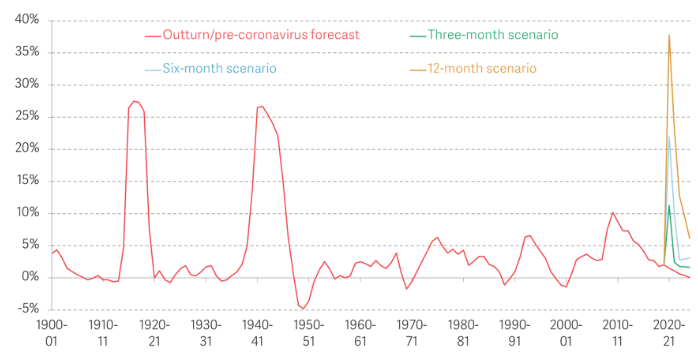
The combined effect of the above factors drives public borrowing to peacetime highs in all three scenarios. Borrowing is estimated to reach 11% of GDP this year in the 3-month scenario, higher than the peak of 10.2% of GDP reached during the financial crisis. In the 6-month scenario, higher policy costs and a more severe economic shock see borrowing reach 22% of GDP this year, levels last seen during WWII. Under a 12-month lockdown, borrowing peaks at 38% of GDP this year, which would be unprecedented in the UK’s history and around 10 percentage points above the highest annual borrowing ever recorded (of 27.5% of GDP in 1916-17).
Figure 2 UK public sector net borrowing as a proportion of GDP under 3, 6, and 12-month lockdown
Notes: Includes all policy announcements to 16 April 2020.
Source: RF analysis of OBR, Economic and Fiscal Outlook, March 2020.
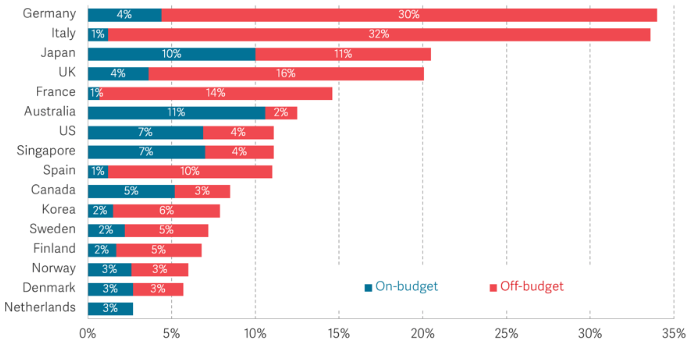
The relative contributions of the economic impact of the virus and the policy response to the overall increase in borrowing differ across the three scenarios. As shown in Figure 3, the UK government has announced one of the largest packages of financial support among advanced economies – even excluding the Bank of England’s policy interventions – costed at around £400 billion (20% of GDP) on the basis of a 3-month lockdown.
Figure 3 Size of fiscal response to coronavirus as a proportion of GDP, advanced economies
Notes: ‘On-budget’ refers to policy measures that increase borrowing, while ‘Off-budget’ refers to contingent liabilities (such as the Government’s Coronavirus Business Interruption Loan Scheme), and measures that impact on debt. The UK is presented excluding Bank of England measures.
Source: IMF, Fiscal Monitor, April 2020.
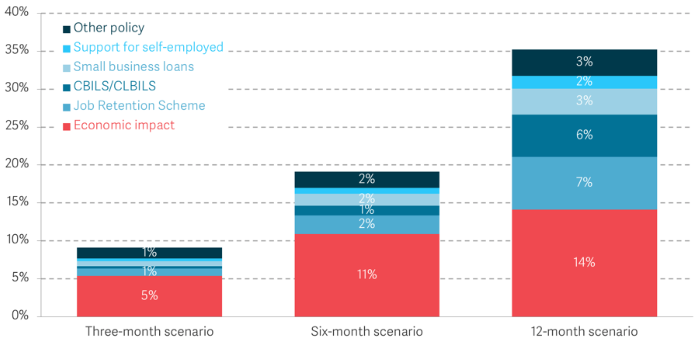
These policy costs compound more rapidly than economic costs as the length of lockdown increases, as illustrated in Figure 4. This is partly because the number of workers claiming salary support under the UK’s Job Retention Scheme increases with the length of the lockdown, rising to 50% of the private sector workforce and adding 7% of GDP to borrowing in the 12-month scenario. The cost of projected write-offs from the government-guaranteed loan schemes (CBILS and CLBILS)2 also increases dramatically across the three scenarios, adding 6% of GDP to borrowing in the 12-month scenario reflecting higher projected default rates as the lockdown goes on.
Figure 4 Economic and policy impacts on UK public borrowing, as a proportion of GDP, 2020-2021
Notes: ‘Other policy’ includes all other policy measures impacting borrowing, e.g. increases in legacy benefits and Universal Credit and support for the charity and travel sectors. Includes all policy announcements to 16 April 2020.
Source: RF analysis of OBR, March 2020 Economic and Fiscal Outlook, March 2020.
Impact on government debt
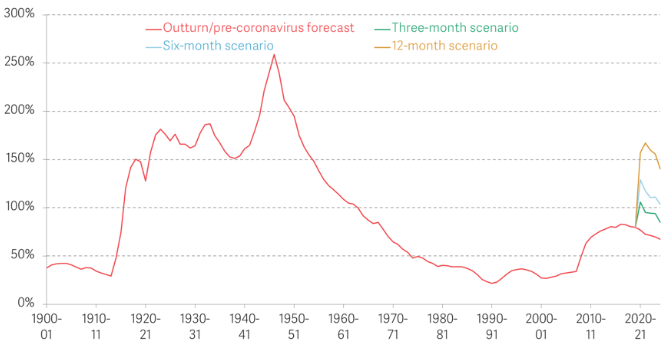
The combined shock to both revenues and expenditure in all three scenarios adds significantly to government debt levels. Debt is estimated to rise to 106% of GDP in the 3-month scenario, over 20 percentage points higher than the peak of 83% reached in the wake of the financial crisis (Figure 5). The 6- and 12-month scenarios would lead to debt peaking at 129% and 167% of GDP, respectively. These are levels not seen since the decade following WWII, during which debt reached an all-time high of 259% of GDP in 1946-47 before falling back to 129% of GDP by 1956-57.
Figure 5 UK public debt as a proportion of GDP under a 3-month, 6-month, and 12-month lockdown
Notes: Includes all policy announcements to 16 April 2020.
Source: RF analysis of OBR, Economic and Fiscal Outlook, March 2020.
The scale and pace of this ramping up of public borrowing, especially in the longer lockdown scenarios, poses two significant fiscal challenges for the UK government: (i) how to finance historic deficits in the near term; and (ii) how to afford this elevated level of debt in the long term.
The near-term challenge: Financing historic deficits this year
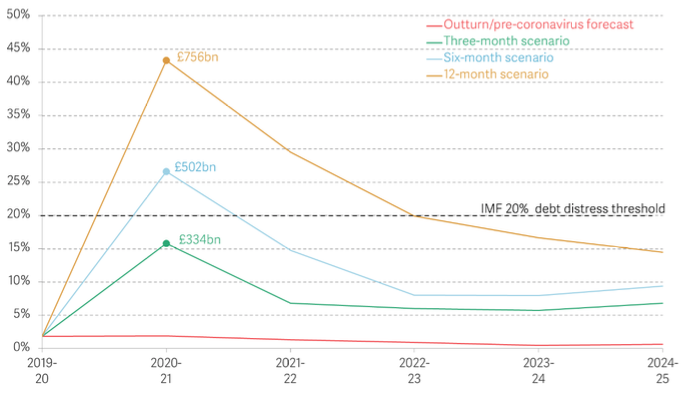
A key near-term fiscal challenge will be mobilising the liquidity required to finance the government’s yawning fiscal deficit this year and to rollover its debts from previous years. The government’s annual gross financing requirement (GFR) includes both the cash required to cover the difference between annual receipts and payments, as well as the financing needed to redeem previously issued debt which matures in that year. In the 3-month scenario, GFR in 2020-21 reaches £334 billion, or 16% of GDP. This rises to 27% of GDP in the 6-month scenario, and 43% of GDP – or more than double the IMF’s 20% debt distress threshold value in the 12-month scenario (see IMF 2013).
Figure 6 UK central government gross financing requirement as a proportion of GDP under 3-month, 6-month, and 12-month lockdown
Notes: Includes all policy announcements to 16 April 2020.
Source: RF analysis of OBR, Economic and Fiscal Outlook, March 2020; and sources for economic and policy costings for scenarios given above.
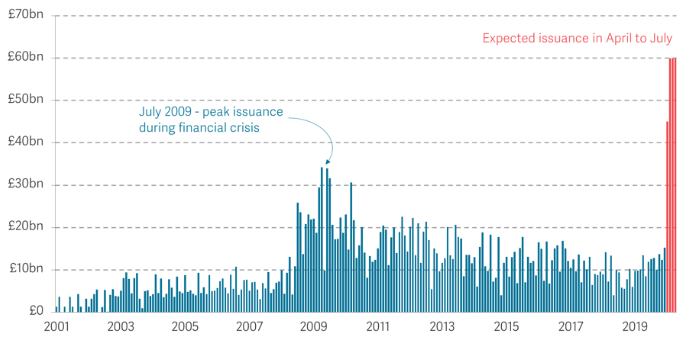
Reflecting the government’s extraordinary liquidity requirement this year, government borrowing is forecast to be almost twice as high in each of the next three months than in any single month during the financial crisis (Leslie 2020a), as shown in Figure 7. On top of that, the UK government has extended its overdraft with the Bank of England (known as the ‘Ways and Means’ facility), reflecting concerns that it may struggle to find sufficient liquidity from market sources at some stage. While the results of recent bond auctions have been positive, a longer lockdown – which puts the liquidity position of both the government and its traditional creditors under growing stress (see IMF 2020b on financial market liquidity constraints) – could require the government to turn to the Bank of England to temporarily ease its liquidity squeeze through direct monetary financing of its deficit (Blanchard and Pisani-Ferry 2020).
Figure 7 Real UK government bond issuance by the Debt Management Office (£ billion)
Notes: Figures show total issuance at operations in cash. Figures are adjusted into 2020-21 prices using the GDP deflator based on the most recent data from the Office for Budget Responsibility. The April 2020 forecast is based on the expected issuance this month and May to July is based on the DMO’s financing remit.
Source: RF analysis of Debt Management Office.
The longer-term challenge: The sustainability of higher debt levels
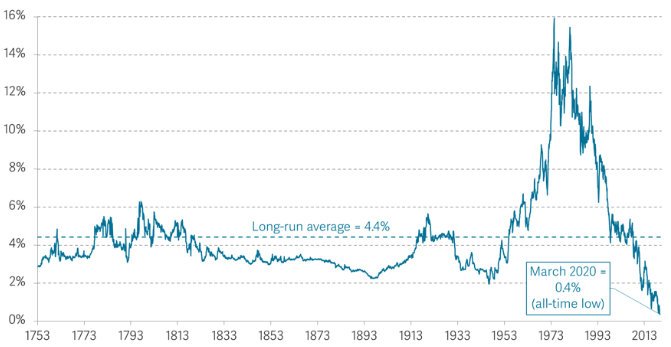
Compared with these unprecedented near-term pressures on the public finances, the long-term fiscal outlook looks paradoxically benign. This is because while coronavirus looks set to push public debt up to levels not seen for several generations, falling borrowing costs actually reduce the annual cost of servicing that debt compared to what was forecast prior to the outbreak. As Figure 8 illustrates, 10-year government bond yields – like long-term interest rates elsewhere – have fallen steadily since the mid-1970s and fell further since the coronavirus outbreak, as investors sought a liquid and safe store of value, reaching an all-time low of 0.4%.
Figure 8 UK government bond yields (10-year benchmark where available)
Notes: Between 1753 and 1934 the source is consol yields; from 1935 to 1969 it is bonds of approximately 10-year maturity.
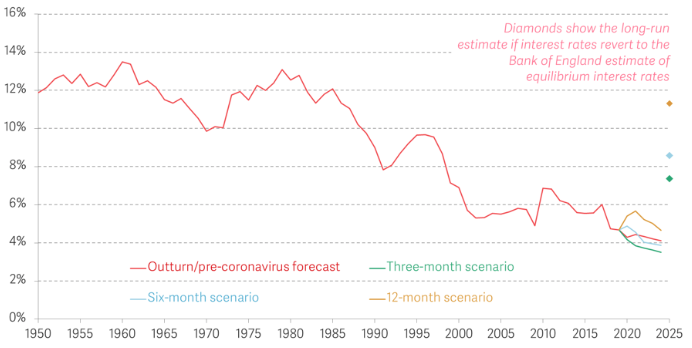
Thanks to these falling interest rates and continued low inflation, the actual burden of servicing that debt is forecast to remain largely unchanged under all three scenarios. As shown in Figure 9, the ratio of debt interest payments to public revenues remains at or below the pre-outbreak 2020 Budget forecast by the end of five years in all three scenarios. And while there is a one-year spike in the ratio in the 12-month scenario, all three scenarios are estimated to entail the debt-interest-to-revenue ratio falling to new historic lows by the end of the forecast period.
Figure 9 UK public sector debt interest as a proportion of public sector revenue under a 3, 6, and 12-month lockdown
Notes: The underlying scenario forecasts are based on gross public sector net debt interest excluding the Bank of England; they have been transformed proportionally to be consistent with public sector net debt interest and so we do not explicitly model the dynamics of net interest directly. The interest rate differential between the bank rate and interest rates for the TFSME lending and CCFF purchases is assumed to be zero, absent more detailed available data. Includes all policy announcements to 16 April 2020.
Source: RF analysis of OBR, various; Bank of England.
Crucially, however, this benign picture holds true only if inflation remains stable and interest rates close to current historic lows (for potential effects of COVID-19 on equilibrium interest rates, see Goy and van den End 2020). Should interest rates rise even to estimates of their subdued equilibrium level, the interest burden could return to levels not seen in the UK in four decades. The diamonds in Figure 9 illustrate the effect on the debt-service-to-revenue ratio of a return to rates of 2.25% (the Bank of England estimate of the equilibrium interest rate). In the 12-month scenario, the debt service-to-revenue ratio would double to 11.3%, a level not seen since the mid-1980s. And with one-quarter of the UK’s outstanding public debt stock in the form of inflation-linked bonds, the coronavirus pandemic would also leave the public finances more exposed to a sudden return of inflation (for the impact of COVID-19 on inflation, see Blanchard 2020 and Miles and Scott 2020). So, while the low interest rate environment means the government certainly can afford the increase in debt that the pandemic demands in the medium-term term, it leaves the public finances significantly more exposed to both interest rate and inflation risks in future.
Concluding remarks
With public sector borrowing and debt looking increasingly likely to reach the historic highs set out in our scenarios as lockdown and social distancing measures remain in place, the UK government has difficult decisions to make to mitigate the near- and long-term pressures on public finances. However, both macro- and microeconomic policy changes could help to mitigate these pressures, as discussed in detail in the full paper on which this column is based (Hughes et al. 2020).
References
Baldwin, R and B Weder di Mauro (2020), Mitigating the COVID Economic Crisis: Act Fast and Do Whatever It Takes, a VoxEU.org eBook, CEPR Press.
Blanchard, O (2020), “Is there deflation or inflation in our future?”, VoxEU.org, 24 April.
Blanchard, O and Pisani-Ferry, J (2020), “Monetisation: Do not panic”, VoxEU.org, 10 April.
Goy, G and Willem van den End, J (2020), “The impact of the COVID-19 crisis on the equilibrium interest rate”, VoxEU.org, 20 April.
Hughes, R (2020), “Safeguarding governments’ financial health during coronavirus: Learning from past viral outbreaks”, VoxEU.org, 29 March.
Hughes, R, Leslie, J, McCurdy, C, Pacitti, C, Smith, J and Tomlinson, D (2020), “Doing more of what it takes: Next steps in the economic response to coronavirus”, Resolution Foundation, 16 April.
International Monetary Fund (2013), Staff Guidance Note for Public Debt Sustainability Analysis in Market-Access Countries, 9 May.
International Monetary Fund (2020a), World Economic Outlook, April 2020, 6 April.
International Monetary Fund (2020b), Global Financial Stability Report, 14 April.
Leslie, J (2020a), “The economic effects of coronavirus in the UK: utilising timely economic indicators”, Resolution Foundation, 24 April.
Leslie, J, R Hughes, C McCurdy, C Pacitti, J Smith and D Tomlinson (2020), “Three scenarios for the impact of coronavirus on the UK economy”, VoxEU.org, 11 May.
Miles D and Scott, A (2020), “Will inflation make a comeback after the crisis ends?”, VoxEU.org, 4 April.
OECD (2020), OECD Economic Outlook, Interim Report March 2020, 2 March.
Office for Budget Responsibility (2020), “Coronavirus reference scenario”, 14 April.
Endnotes
1 BBC News, "Coronavirus: Social restrictions ‘to remain for rest of year", 22 April 2020.
2 The Coronavirus Business Interruption Loan Scheme (CBILS) and Coronavirus Large Business Interruption Loan Scheme (CLBILS) are both administered through the British Business Bank. Loans issued under the schemes are partially guaranteed by the Government. On 27 April the Government also announced the introduction of ‘Bounce Back’ loans for SMEs of up to £50,000 that are fully guaranteed by Government (these are not included in the scenario policy costings).


