The impact of immigration on the tax and welfare system and the net fiscal consequences is perhaps the single most prominent economic issue in the public debate over the pros and cons of immigration. Accordingly, it is the debate about the fiscal effects – and not so much the effects on wages – of immigration that is currently dominating the debate not only in the UK, but also in other countries (see Boeri 2010).In an analysis of data for more than 20 European countries, we show that concerns about the burden of migration on the public coffers is dominating concerns about labour-market competition and economic efficiency (Dustmann and Preston 2006).
The fiscal impact of immigration to the UK
It is therefore surprising how little evidence exists on how much immigrants receive from and contribute to the public purse. In the UK – a country where the recent political debate has been particularly fierce – the available evidence has so far been scattered, covering only a few selected years, and/or particular sub-populations (Gott and Johnston 2002; Sriskandarajah, Cooley, and Reed 2005; Dustmann, Frattini, and Halls 2010). Preston (2013) provides a conceptual survey of the key issues in computing the fiscal effects of immigration.
In a new paper, we fill this gap by studying immigrants’ net fiscal contribution over the period from 1995 to 2011 (Dustmann and Frattini 2013). In doing so, we distinguish between all immigrants who resided in the UK in the years from 1995 onwards, and immigrants who arrived since 2000 (we refer to these immigrants as ‘recent’ immigrants). We further distinguish two groups – immigrants from countries that are not part of the European Economic Area (EEA), and immigrants from EEA countries.
Measuring the fiscal impact of immigration
Based on the UK Labour Force Survey and a multitude of government sources, we compute the net fiscal contribution of the different population groups by assigning individuals their share of the cost of each item of government expenditure and identifying their contribution to each source of government revenues. We are able to provide precise estimates for each year since 1995 (2001 for recent immigrants) on both the overall expenditure on the respective immigrant populations and the revenues they have produced in comparison to native-born workers. Thus, we provide a clean picture of the UK immigrant populations’ net contribution to the tax and benefit system over 17 years. It is this calculation that we believe is important for the public debate on the fiscal effects of immigration.
Immigration to the UK
Over the past 15 years the native population in the UK has increased by about one million from 53.4 to 54.4 million. The immigrant population, on the other hand, has grown substantially, from about 3.8 million in 1995 to around 7.6 million in 2011 – an increase from 6.8% to 12.1% of the general population in just 17 years (here we define as immigrants all foreign-born individuals).
What is particularly remarkable is the immigrant population’s educational achievement, which has been consistently higher than that of the native population since 1995 – with an increasing gap ever since. For instance, while by 2011 the percentage of natives with a degree was 21%, that of EEA and non-EEA immigrants was 32% and 38%, respectively. Similarly, about half of native-born individuals fall into the ‘low education’ category (defined as those who left full-time education before 17), while only one in five EEA immigrants and one in four non-EEA immigrants do so.
The fiscal contribution of all immigrants, 1995-2011
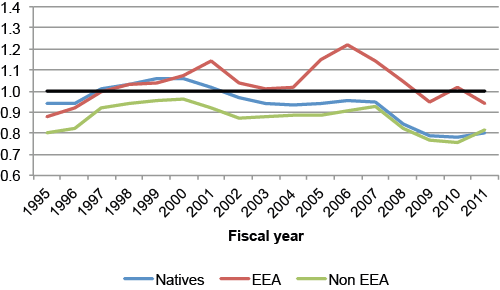
Between 1995 and 2011, immigrants from EEA countries made a positive net fiscal contribution of about £8.8 billion (in 2011 equivalency), compared with an overall negative net fiscal contribution of £604.5 billion by natives. Thus, between 1995 and 2011, EEA immigrants contributed to the fiscal system 4% more than they received in transfers and benefits, whereas natives’ payments into the system were just 93% of what they received, resulting in an overall netative contribution. This is, of course, not surprising since the UK ran a deficit over many of these years.
On the other hand, immigrants from non-EEA countries have made a negative fiscal contribution overall when considering all years between 1995 and 2011 by about £104 billion. There are two factors that may explain this shortfall. First, their demographic structure – non-EEA immigrants have had more children than natives, and we have allocated educational expenditure for children to immigrants (ignoring that immigrants arrived with their own educational expenditure paid for by the origin country).
Second, due to the nature of our data, we cannot assign the immigrant status of the parents to adult individuals. Thus, while we include among the fiscal costs of immigrants the expenditure for the education of their UK-born children, we are not able to factor in the positive fiscal contributions second generation immigrants are likely to make when they grow up, work and pay taxes. This is likely to result in an underestimation of the overall net contribution of the immigrant population.
In Figure 1, we illustrate the net fiscal contributions of the three groups year by year, and over the period 1995-2011.
Figure 1 Ratio of revenues to expenditures for natives EEA and non-EEA immigrants, 1995-2011
Note: the black horizontal line indicates revenues equal expenditures
The fiscal contribution of recent immigrants, 2000-2011
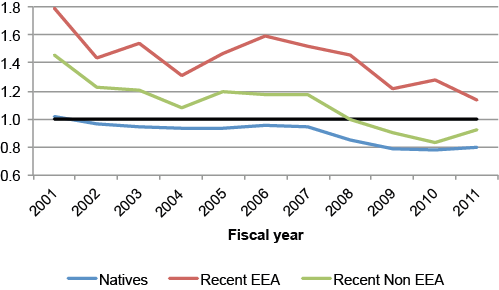
The contribution of recent immigrants (i.e. those who arrived after 1999) to the UK fiscal system has been consistently positive and remarkably strong. Between 2001 and 2011, recent EEA immigrants contributed to the fiscal system 34% more than they took out, with a net fiscal contribution of about £22.1 billion. At the same time, recent immigrants from non-EEA countries made a net fiscal contribution of £2.9 billion, thus paying into the system about 2% more than they took out. In contrast, over the same period, natives’ fiscal payments amounted to 89% of the amount of transfers they received, or an overall negative fiscal contribution of £624.1 billion. The net fiscal balance of overall immigration to the UK between 2001 and 2011 amounts therefore to a positive net contribution of about £25 billion, over a period over which the UK has run an overall budget deficit.
In Figure 2, we illustrate the net fiscal contributions of the three groups over that period, year by year.
Figure 2 Ratio of revenues to expenditures for natives, recent EEA and recent non-EEA immigrants, 2001-2011
Note: the black horizontal line indicates revenues equal expenditures
Our analysis thus suggests that – rather than being a drain on the UK’s fiscal system – immigrants arriving since the early 2000s have made substantial net contributions to its public finances – a reality that contrasts starkly with the view often maintained in public debate.
This conclusion is further supported by our evidence on the degree to which immigrants receive tax credits and benefits compared with natives. Recent immigrants are 45% (18 percentage points) less likely to receive state benefits or tax credits. These differences are partly attributable to immigrants’ more favourable age-gender composition. However, even when compared with natives of the same age, gender composition, and education, recent immigrants are still 21% less likely than natives to receive benefits.
We thus conclude that the recent wave of immigrants – those who arrived in the UK since 2000, and who have driven the stark increase in the UK’s foreign-born population – contributed far more in taxes than they received in benefits. Furthermore, by sharing the cost of fixed public expenditures (which account for 23% of total public expenditure), they reduced the financial burden of these fixed public obligations for natives.
The role of demographics
One may argue that part of our positive picture of recent UK immigrants (i.e. those who arrived since 2000) may be related to their favourable age structure. While we cannot compute counterfactuals for the net fiscal contributions of recent immigrants if they had the same age structure as natives, our results for tax credits and benefit receipts (where we do compute such counterfactuals) remain favourable for immigrants relative to natives even assuming the same age structure for the two groups (see above).
Further, while ageing of the immigrant population that arrived since 2000 may lead in the longer run to an increase in benefit receipts, this is likely to be counteracted by two factors.
- First, it is likely that many of these immigrants will return migrate, thus spending their later and less productive years in their home countries.
- Second, a large fraction of these recent immigrants are at the beginning of their careers – and possibly underemployed for lack of complementary skills such as language – and thus are far from reaching their full economic potential (see Dustmann, Frattini, and Preston 2013).
Hence, although their net contributions may decrease in later years because of demographic changes, given their far more favourable educational distribution, the contributions of those who decide to stay in the UK will likely increase through individual career development.
We should also note that most immigrants arrive in the UK after completing their education abroad, and thus at a point in their lifetime where the discounted value of their future net fiscal payments is positive. If the UK had to provide to each immigrant the level of education they have acquired in their home country (and use productively in the UK, as natives do), the costs would be very substantial. This aspect is often neglected in the debate about the costs and benefits of immigration.
References
Boeri, Tito (2010), “Immigration to the Land of Redistribution”, Economica 77: 651–687.
Dustmann, Christian and Tommaso Frattini (2013), “The Fiscal Effects of Immigration to the UK”, CReAM DP No. 22/13.
Dustmann, Christian, Tommaso Frattini and Caroline Halls (2010) “Assessing the Fiscal Costs and Benefits of A8 Migration to the UK”, Fiscal Studies 31(1): 1–41.
Dustmann, Christian and Ian Preston (2006), “Is Immigration Good or Bad for the Economy? Analysis of Attitudinal Responses”, Research in Labor Economics 24: 3–34.
Dustmann, Christian, Tommaso Frattini and Ian Preston (2013), “The Effect of Immigration along the Distribution of Wages”, Review of Economic Studies 80(1): 145–173.
Gott, Ceri and Karl Johnston (2002), “The Migrant Population in the UK: Fiscal Effects”, Home Office Research, Development and Statistics Directorate Occasional Paper No. 77.
Preston, Ian (2013), "The Fiscal Effects of Immigration to the UK", CReAM DP No. 22/14.
Sriskandarajah, Dhananjayan, Laurence Cooley, and Howard Reed (2005), “Paying Their Way: The Fiscal Contribution of Immigrants in the UK”, Institute for Public Policy Research.


