The Global Crisis focused attention on unsustainable leverage growth as a key contributing factor in growing the financial fragility associated with ‘bubbly’ dynamics. Essentially, a prolonged appreciation of financial and real estate markets increases vulnerability to sharp asset valuation corrections. A deep enough correction may trigger banking crises and fire sales dynamics, potentially pushing the economy into a prolonged depression, with growing exposure to social and political instability.1 Concerns about reliving the Great Depression explain the complex set of policies implemented by the US and other affected countries in the aftermath of the Global Crisis – a massive infusion of liquidity in support of financial and banking systems, and bailing out systemic banks and prime creditors. The forced deleverage of private borrowers, and the growing fear of a prolonged recession, induced higher household savings and lower investment, further deepening recessionary forces.
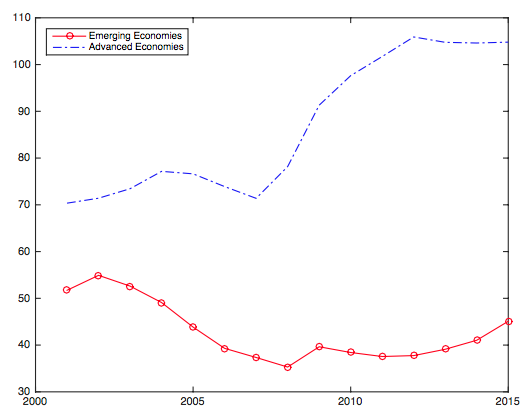
Many countries thus experimented with fiscal stimuli aimed at mitigating the deepening recessions. Stabilising the banking and financial systems, in addition to the stimuli, ended up sharply raising countries’ public debt-to-GDP ratios, pushing advanced countries towards ratios of above 100% (see Figure 1). Similar trends applied to emerging market economies (EMEs), driving their debt-to-GDP ratios upward, with some reaching well above 50%. Notwithstanding the fact that the average debt-to-GDP ratio of EMEs is below that of OECD countries, EMEs’ lower tax base-to-GDP ratios, as well as the higher interest rates paid on their debt (due to sovereign risk premia), imply a rising fragility of these countries compared with OECD countries. As such, while the debt-to-GDP ratio is used frequently in policy discussions, accounting for tax base and the ratio of public debt to the average tax base may provide a more informative measure of the fiscal burden associated with the stock of public debt.2
Figure 1 Public debt/GDP (%) in advanced economies, and emerging markets and developing economies
Source: World Economic Outlook; authors’ calculations.
Importantly, the post-crisis trajectory failed to deal with leverage concerns. “At $164 trillion – equivalent to 225% of global GDP – global debt continues to hit new record highs almost a decade after the collapse of Lehman Brothers. Compared with the previous peak in 2009, the world is now 12% of GDP deeper in debt, reflecting a pickup in both public and nonfinancial private sector debt after a short hiatus. All income groups have experienced increases in total debt, but, by far, EMEs are in the lead” (Fiscal Monitor 2018). In other words, stabilising a crisis triggered by an unsustainable leverage growth in turn contributed to a potentially untenable increase in leverage/GDP ratios.
For the past decade, the monetary easing associated with the US Federal Reserve and the ECB policies in the aftermath of the crisis led to an unprecedented decline of policy interest rates and risk premia. These developments markedly reduced the flow costs of serving the rising public and private debt, thereby masking the increasing fragility associated with the rising aggregate leverage/GDP. This period has now passed – the (so far) robust recovery of the US, the gradual unwinding of the Fed’s balance sheet, the projected upward trajectory of the Fed’s funds rate, and the recovery of the euro area will impose growing fiscal challenges that will test countries’ fiscal space and their ability to cope with projected higher interest rates by raising their resilience.
A key resilience margin is securing fiscal space – that is, the fiscal capacity of countercyclical policy aimed at mitigating business cycles and preventing a prolonged depression in the aftermath of financial crises (Auerbach 2011, Ostry et al. 2010, see also Gavin et al. 1996on the identification of fiscal procyclicality as a major amplifier of developing countries’ vulnerability to shocks). Remarkably, over the two decades leading to the Global Crisis, a growing share of fiscal policies in developing countries and EMEs had graduated from procyclicality to become countercyclical (Frankel 2011, Frankel et al. 2013). Cross-country studies offer several explanations. Woo (2009)presented some evidence showing that social polarisation, as measured by income and educational inequality, is consistently and positively associated with fiscal procyclicality, controlling for other determinants; there is also a robust negative impact of fiscal procyclicality on economic growth. In a previous paper (Aizenman and Jinjarak 2012), two of us found that higher income inequality is strongly associated with a lower tax base, lower de facto fiscal space, and higher sovereign spreads. Vegh and Vuletin (2015) find that tax policy is less procyclical/more countercyclical in countries with better institutional quality and that are more financially integrated; tax and spending policies are conducted in a symmetric way over the business cycle.3
Against this background, in a recent paper we assess definitions and empirical measures of fiscal cyclicality, compare fiscal cyclicality across countries and regions, and then identify factors accounting for spending and tax policy cyclicality patterns (Aizenman et al. 2018). We link the capacity of countercyclical policy to the fiscal space and the stage of economic and institutional development, as both are associated with the servicing capabilities of domestic and foreign debt. Our analysis focuses on differences across the country groups and examine the role of economic structure (commodity versus manufacturing outputs), financial openness, as well as institutions and socio-economic factors (political risks, polarisation, and ethnic polarisation).
Our study reveals a mixed fiscal scenery, where more than half of the countries are characterised by limited fiscal space, and fiscal policy is either procyclical or acyclical. More limited fiscal capacity and itsvolatility are positively associated with fiscal cyclicality, while public debt-to-GDP is statistically significant in several cases, suggesting that the ratio of public debt to the tax baseprovides a robust fiscal-space explanation for studying government spending and tax rate cyclicality.4 The cyclicality is asymmetric – on average, a more indebted (relative to the tax base) government spent more in good times (positive growth) and cut back the spending even more in bad times (weak economy).
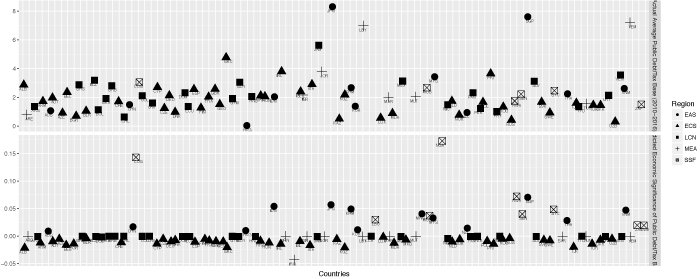
We also find that a country’s sovereign wealth fund has a countercyclical effect in our estimation. Our analysis depicts a significant economic impact of an enduring interest-rate rise on fiscal space – a 10% increase in public debt over the tax base is associated on average with an upper bound of a 6.1% increase in government spending procyclicality (see Figure 2, bottom panel for the cross-country distribution of this effect). For bothgovernment spending cyclicality and tax rate cyclicality, we find no one-size-fit-all explanation for all (OECD and developing) countries in both good and bad times. Fiscal space, trade and financial openness, the share of natural resource and manufacturing exports, inflation, and institutional risks are associated with the cross-country patterns of fiscal cyclicality, suggesting the measured cyclicality is context-specific and fiscal/monetary/political economy interactions are at work. In our paper, we rank the explanatory factors across countries and regions, and discuss policies to increase the fiscal capacity for countercyclical policy.
Figure 2 Public debt, tax base average, and government spending cyclicality, 2010–2016
Notes: Public debt/tax base average over 2010–2016 (top panel); The estimated change of government spending cyclicality associated with public debt/tax base increases by 10% (lower panel).5
References
Aizenman, J, M Hutchison and Y Jinjarak (2013), “What is the risk of European sovereign debt defaults? Fiscal space, CDS spreads and market pricing of risk,” Journal of International Money and Finance 34: 37–59.
Aizenman J, Y Jinjarak, H Nguyen, D Park (2018), “Fiscal space and government spending & tax-rate cyclicality patterns: A cross-country comparison, 1960-2016,” NBER Working paper 25012.
Aizenman, J and Y Jinjarak (2012), “Income inequality, tax base and sovereign spreads,” FinanzArchiv: Public Finance Analysis 4(68): 431–444.
Alesina, A, C Favero and F Giavazzi (2015), “The output effect of fiscal consolidation plans,” Journal of International Economics 96: S19–S42.
Auerbach, A J (2011), “Long-term fiscal sustainability in major economies,” BIS, Working Paper 361.
Frankel, J (2011), “A solution to fiscal procyclicality: The structural budget institutions pioneered by Chile,” Journal Economía Chilena 14(2): 39–78.
Frankel, J A, C A Vegh and G Vuletin (2013), “On graduation from fiscal procyclicality,” Journal of Development Economics 100(1): 32–47.
Gavin, M, R Hausmann, R Perotti and E Talvi (1996), “Managing fiscal policy in Latin America and the Caribbean: Volatility, procyclicality, and limited creditworthiness,” Inter-American Development Bank, Working paper 326.
Jordà, Ò, M Schularick and A M Taylor (2013), “When credit bites back,” Journal of Money, Credit and Banking 45(2): 3–28.
Leeper, E, N Traum and T Walker (2017), “Clearing up the fiscal multiplier morass,” American Economic Review 107(8): 2409–54.
Ostry, J, A Ghosh, J Kim and M Qureshi (2010), “Fiscal space,” IMF Staff Position Note SPN/10/11.
Rajan, R G (2006), “Has finance made the world riskier?” European Financial Management 12(4): 499–533.
Schularick, M and A M Taylor (2012), “Credit booms gone bust: Monetary policy, leverage cycles, and financial crises, 1870–2008,” American Economic Review 102(2): 1029–1061.
Vegh, C A and G Vuletin (2015), “How is tax policy conducted over the business cycle?” American Economic Journal: Economic Policy 7(3): 327–370.
Woo, J (2009), “Why do more polarized countries runmore procyclical fiscal policy?” Review of Economics and Statistics 91(4): 850–870.
Endnotes
[1] Rajan (2006) pointed out that banking deregulation during the 1980s–2000s increased leverage and risk taking, contributing to a greater exposure to financial stability associated with tail risks. Schularick and Taylor (2012) and Jordà et al. (2013) provided empirical evidence linking leverage, business cycles, and crises.
[2] The euro crisis provided a vivid example of how focusing on public debt/GDP below a certain threshold caused a failure to recognise the large heterogeneity of the tax base/GDP in the Eurozone (Aizenman et al. 2013). Similarly, the interest expense needed to serve the public debt as a share of tax revenue may provide a robust measure of the burden of serving the public debt and be more informative than the interest cost of the public debt/GDP ratio.
[3] Related strands of the literature examine fiscal multipliers (Leeper et al. 2017, Ilzetski et al. 2013); fiscal rules (IMF 2017); and large fiscal adjustments (Alesina et al. 2015). Empirically, fiscal cyclicality, fiscal multipliers, fiscal rules, and large fiscal adjustments are intertwining issues.
[4] Public debt/tax base in public finance is akin the net debt to earnings before interest depreciation and amortisation ratio in the corporate sector (aka debt/EBITDA). Net debt to earnings ratio is a measurement of leverage, how many years it would take for a company to pay back its debt if net borrowing is zero, and EBITDA are held constant; used frequently by credit rating agencies. “Ratios higher than 4 or 5 typically set off alarm bells because this indicates that a company is less likely to be able to handle its debt burden, and thus is less likely to be able to take on the additional debt required to grow the business”, see here.
[5] Iraq, Japan, Singapore, Egypt, Greece, Libya, Yemen, and Jamaica show limited fiscal capacity based on the 2010–2016 data, accumulating public debt four to eight times larger than their tax base (Iraq has public debt approximately forty times higher than its tax revenue). According to the calculation, fiscally fragile countries are mostly in sub-Saharan Africa (Republic of Congo, Nigeria, Rwanda Seychelles,) and a few cases in East Asia and the Pacific (Vietnam, Indonesia, Cambodia, and Japan).


