Financial prices appear to exhibit ‘fractal’ properties over time. A defining property of fractals is the tendency of an object to be similar to parts of itself.1 To fix ideas before turning to financial markets, consider a well-known natural example – an oak tree (Figure 1).
Figure 1. A fractal tree
From a distance, the tree-branch pattern resembles a trunk with some large branches and a smooth crown. Zoom in on one large branch, and we see a branch with smaller branches. Zoom in on a small branch and the same pattern with the small branch and twigs. Successive, ‘generations’ of branches become smaller, yet the pattern of each echoes that of the previous generation. This is called a structure with ‘self-similarity’.
Such self-similarity produces objects that appear simple and smooth from a distance. But, under magnification, their pattern seems increasingly complex in ways that are repeated at increasingly fine degrees of resolution. This property is present in financial market prices.
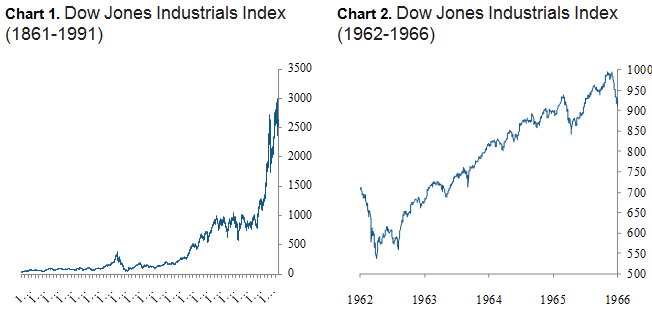
- From a ‘distance’ – i.e. viewed over a long time scale – market prices appear smooth, almost deterministic.
Chart 1 plots the daily prices of the Dow Jones equity index from 1896. This roughly resembles an exponential pattern.
At shorter-time scales reveal two phenomena:
- First, the series yields increasing complexity or ‘roughness’.
The smoothness of any particular portion of the series gives way to a rougher pattern (Chart 2).
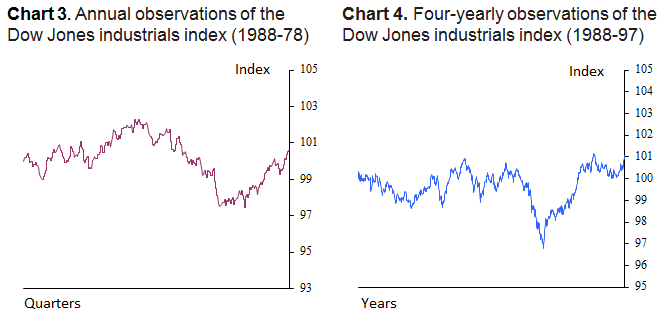
- Second, the pattern of prices seems qualitatively similar at different levels of resolution.
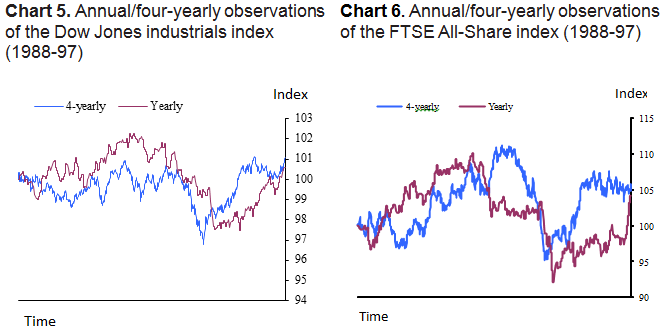
Charts 3 and 4 show the Dow Jones index between 1988 and 1997, but with the price series sampled at different frequencies. Thus the annual series shows the movements in price observed over the course of a year; whereas, the ‘four-yearly’ series shows the movements in price over the course of four years.2 Chart 5 shows the series overlaid on each other. For comparison, Chart 6 shows a similar phenomenon for the FTSE All-Share index.
These price series would appear to exhibit self-similarity. For time series this means an invariance of their structure to the time scale on which they are viewed.
The Fractal Market Hypothesis
Our recent research examines why and how these fractal properties of market prices might arise. We also consider the implications for understanding the causes of financial (in)stability (ADD ). In particular, we revisits the ‘Fractal Market Hypothesis’ (FMH ), a theory of market behaviour proposed by Peters (1991). This conjectures that the dynamic of market prices – in particular its self-similarity – might be caused by the interactions of agents with different time horizons and differing interpretations of information.
Source: Global Financial Data.
At the heart of the FMH lie two elements missing from more established theories of asset pricing.
- A role for market liquidity; and
- The related impact of information.
Loosely speaking, market liquidity is generated whenever investors trade with each other. And for this to be the case, it is posited that two investors must have different views on a security’s value.
Two interpretations of investor horizon
- This might arise in situations where one investor has information on its value to which another investor does not have access.
An example is so-called ‘high-frequency traders’ who are able to pay a premium to observe market prices – information relevant to valuing a security – at a higher frequency than the wider investment community; see Haldane (2011).
- Alternatively, two investors may receive information simultaneously, but place a different weight on its importance.
For example, for investors with short-term horizons, such as some hedge funds, the daily distribution of returns may have a large bearing on their trading behaviour. In particular, a fall in prices commensurate with, say, three standard deviations of daily returns might be seen as highly adverse precipitating a sell. But to a longer-term investor — for example, ‘real money’ investors such as pension funds — these daily high and lows may be less important. Such investors might judge their performance against the longer-term distribution of prices, under which a three standard deviation move is commensurate with a far more extreme movement in price than that of daily returns.
A ‘special’ sort of (financial) stability
Importantly, particularly from the perspective of a regulator or macroprudential policymaker, differences in the interpretation of information may imply price stability, at least under standard market conditions.
- When a day-trader experiences a price move that they judge to be of sufficient severity to cause them to sell, a longer-term investor may step in and buy from them, thereby preventing significant price falls.
- The long-term investor may be willing to do so because, from their perspective, the day-trader’s n-sigma event is not unusual (unless, of course, n is very large): judged by the longer-term distribution of returns, it is closer to the mean.
In this way, financial markets can be considered as embodying a ‘special sort’ of stability.
Interestingly, self-similar fractal structures seem to be favoured by nature as a way of ensuring the stability of systems in the natural world. In the case of the tree, for example, it is determined globally that each branch will divide to yield two or more branches, defining its overall structure. But, importantly, branches of successive generations are not identical. This ensures that if one branch of a tree were malformed, there would be other branches to compensate. The global determinism of the structure and its local randomness combine to mean the overall structure of the tree is not threatened by the presence of malformed branches. The fractal structure seems to embody a certain ‘tolerance to error’ that helps preserve the stability of the system.
Breakdowns in the fractal structure
It follows that financial markets can become prone to instability when this fractal structure is broken. Such a breakage could occur when investors with a longer horizon either stop participating in the market, or become short-term investors.
Reasons for such an eventuality can be mapped to our two differing interpretations of investor horizon:
- The original explanation offered by Peters (1991) has an exogenous event causing the short-term investors to sell and the consequent fall in prices causing long-term investors to doubt the validity of the information on which they base their behaviour.
For example, they may become uncertain as to their view of the longer-term payoffs of a security, formed through some measure of economic fundamentals. An example of one such event is the disruption surrounding 11 September 2001. In this case, the consequences for the long-term prospects for the economy were so uncertain that longer-term investors ‘lost faith’ in their view of economic fundamentals. They subsequently stopped trading or to begin trading on overwhelmingly negative short-term market dynamics.
- A more subtle and endogenous explanation explored by Haldane (2011); because long-term investors view the market less regularly than short-term players, they come to doubt the veracity of the information given by prices in a market where other investors view prices more frequently.
In either case, the removal of longer-term investors from the market, or reduction in their trading horizon, causes liquidity to evaporate as there is no longer heterogeneity of investor valuations.
This insight has potentially important policy implications
Haldane (2011) suggests that it accounted for the lack of market liquidity during the 2010 Flash Crash. In the presence of high-frequency traders, the fractal characteristics of markets – including the risk of dispersion in future prices – emerged at shorter time scales. This dynamic aggravated the risks faced by lower frequency firms faced and, in the extreme, meant they could not see the price at which they could trade. In other words, they lay at an acute information disadvantage in times of stress, unable to make markets without risking being arbitraged by higher-frequency traders. This may have caused them to withdraw from the market, reducing liquidity, and causing the crash.
The Fractals Market Hypothesis suggests a number of possible responses of public policymakers that could help reinforce the confidence of longer-term investors, and thereby bolster market stability. Three such types of policies are:
- First, market-making guidelines could seek to ensure a commitment by market makers to provide liquidity at all times.
This would in effect ensure some heterogeneity of investor actions, and hence maintain investor interaction, and market liquidity – even during times of stress. This would, at least in principle, reduce the most pernicious aspect of the FMH, by reducing the occurrence and severity of market crashes.
- A second variety of policy response supported by the FMH is that of market ‘circuit breakers’.
Proposals to introduce such mechanisms date back a number of decades, including in response to the stock market crash of 1987, as outlined in the report of the so-called Brady Commission (see US Department of the Treasury (1988).
At their most basic, circuit breakers are simple rules under which all trading of a given product on a given exchange is halted if prices move too erratically, as judged by some pre-set criteria. Under the fractals view, such a break in trading would allow for the resolution of any informational asymmetries between investors who view the market at different frequencies, allowing longer-term investors to regain their confidence in market information and lessen the probability of their withdrawal during times of stress.
- A third type of policy proposal is that of minimum resting periods.
These impose a minimum delay between the time at which a trade on a given exchange is submitted, and that at which it is executed. The justification from the fractals hypothesis is clear. Minimum resting periods serve as an ex-ante counterpart to market circuit breakers. They ‘slow trading down’ and maintain longer-term investors’ confidence in market information across all states of the world (rather than just those of liquidity draughts).
But there are also potential drawbacks: minimum resting periods would increase the costs of transactions by high-frequency traders. Depriving the market of this class of investor may have an adverse effect on liquidity, at least during normal times (Hasbrouck and Saar 2011).
Conclusions
Our research revisits the Fractal Market Hypothesis where the self-similarity of financial price series comes about due to the interaction of investors with different investment time horizons. There are other ways to understand the observed statistical distribution of financial market prices, but the fractals view stresses the importance of long-term investors for market stability. It also suggests specific policy responses to instability.
References
Anderson, N and J Noss (2013), ‘The Fractal Market Hypothesis and its implications for the stability of financial markets’, Bank of England Financial Stability Paper No. 23.
Haldane, A (2011), ‘The race to zero’, available at www.bankofengland.co.uk/publications/Documents/speeches/2011/speech509.pdf.
Hasbrouck, J and Saar, G (2011), ‘Low-latency trading’, Johnson School Research Paper Series.
Peters, E (1991), Fractal Market Hypothesis, Wiley Finance.
US Department of the Treasury (1988), "Report of the presidential task force on market mechanisms", Washington DC.
1 Theorists have yet to agree on an exact mathematical definition of fractals, but there is a broad consensus that this self-similarity is one defining characteristic.
2 Note that each series is constructed as an average over the relevant time period and has been rescaled to begin at 100 and have the same mean value.


