The October 2018 edition of the World Economic Outlook predicts that global economic growth will remain steady between 2018 and 2020 at the 2017 growth rate of 3.7% (IMF 2018). This exceeds the growth rate in any year between 2012 and 2016.
So, the global economy is growing, but so is uncertainty. Headlines that have appeared in the Financial Times in 2018 include: “Stocks unsettled by global trade uncertainty”, “Counting the costs of Brexit uncertainty”, “Latin America faces up to growing uncertainties”, “Italian bonds under pressure from budget uncertainty”, and “Boeing deal with Embraer faces political uncertainty".
A Google news search for “uncertainty” gives about 0.6 million results for the whole of 2017, but 2.5 million results for the first ten months of 2018. Can we measure 'uncertainty' more precisely? Or compare the amount of 'uncertainty' in the US to that in China, the UK, or Ireland?
Measurements of economic and political uncertainty have been made only for a set of mostly advanced economies (Baker et al. 2016). We have constructed a new index of uncertainty for 143 countries using Economist Intelligence Unit (EIU) country reports. To the best of our knowledge, this is the first effort to construct a panel index of uncertainty for a large set of developed and developing countries.
Constructing the World Uncertainty Index
We constructed the World Uncertainty Index (WUI) – a quarterly index of uncertainty – for 143 individual countries from 1996 onwards. The WUI is defined using the frequency of the word 'uncertainty' (and its variants) in the quarterly EIU country reports. To make the WUI comparable across countries, the raw count is scaled by the total number of words in each report.
In contrast to existing measure of economic policy uncertainty, two factors help improve the comparability of the WUI across countries:
- The WUI is based on a single source. This source has specific topic coverage – economic and political developments.
- Reports follow a standardised process and structure.
The process through which the EIU country reports are produced helps to mitigate concerns about the accuracy, ideological bias, and consistency of the WUI. But we only have one EIU report per country per quarter, meaning there is potentially quite large sampling noise.
Stylised facts
This dataset allows us to establish five key facts:
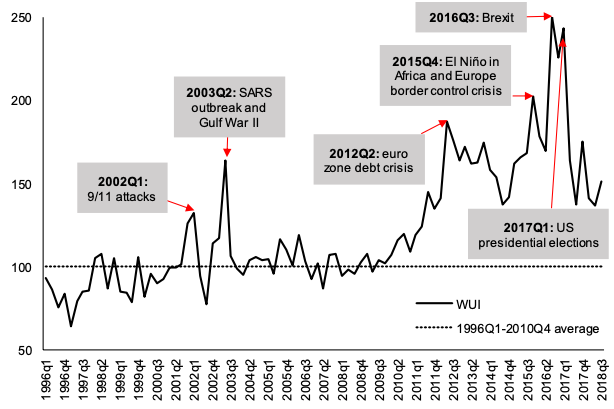
1. Global uncertainty has increased significantly since 2012. Figure 1 shows that average uncertainty has increased since 2012, well above its historical average (computed between 1996 Q1 and 2010 Q4). The index spikes near the 9/11 attacks, the SARS outbreak, the second Gulf War, the euro area debt crisis, El Niño, the Europe border-control crisis, the UK referendum vote for Brexit, and the US presidential elections.
Interestingly, while text-based measures of uncertainty have been rising since the early 2000s, financial market measures rose until about 2010, but have fallen back to low levels (Pastor and Veronesi 2017).
Figure 1 Global WUI, 1996-2018 (unweighted global average)
Source: Ahir et al. (2018).
Note: The WUI is computed by counting the frequency of uncertain (or the variant) in EIU country reports. It is then normalised by total number of words and rescaled by multiplying by 1,000. Here is also rescaled by the global average of 1996 Q1 to 2010 Q4 such that 1996 Q1 – 2010 Q4 = 100. A higher number means higher uncertainty, and vice versa.
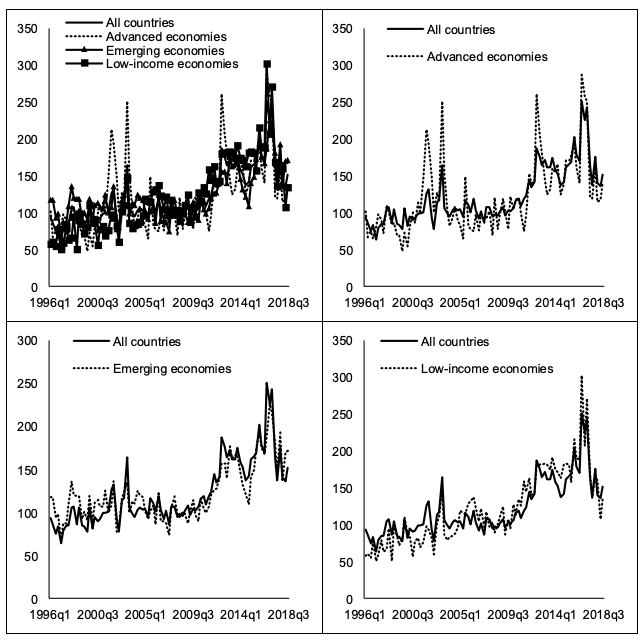
2. Uncertainty spikes are more synchronised in advanced economies than in emerging and low-income countries. Within advanced economies, uncertainty synchronisation is higher in the euro area countries (Ahir et al. 2018). We find that uncertainty synchronisation is positively related with trade and financial linkages (see Figure 2), even when controlling for business cycle synchronisation, so that more integrated economies tend to be characterised by similar uncertainty spikes.
Figure 2 WUI by income group, 1996-2018
Source: Ahir et al. (2018).
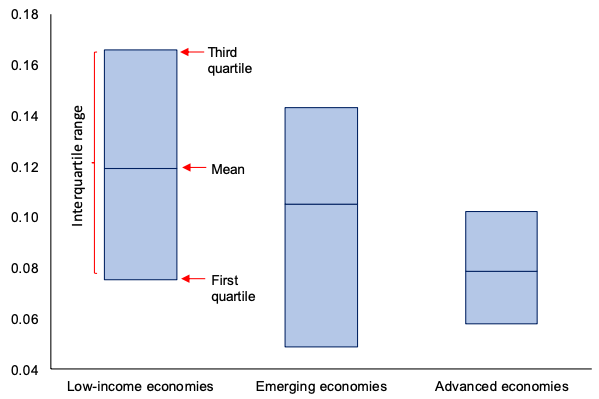
3. Uncertainty is higher in emerging and low-income economies than in advanced economies. You can see this in Figure 3. There is significant heterogeneity. For example, the WUI for the UK, because of the increase in uncertainty associated by the vote in favour of Brexit, is higher than those of many emerging market and low-income countries.
Figure 3 Average WUI by income group, 1996-2018
Source: Ahir et al. (2018).
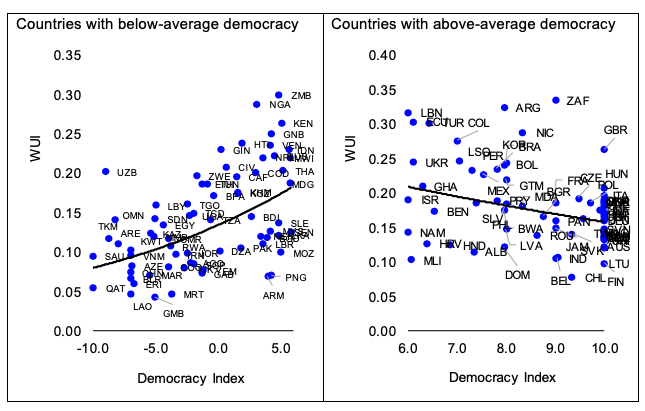
4. There is an inverted U-shaped relationship between uncertainty and democracy. As countries move from a regime of autocracy and anocracy towards democracy, uncertainty increases (Figure 4). As countries move from some degree of democracy to full democracy, uncertainty declines.
Figure 4 Relationship between uncertainty and political regimes, 1996-2018
Source: Ahir et al. (2018).
Note: The democracy index comes from the Center for Systemic Peace, which classifies the country regimes as 10: full democracy, 6-9: democracy, 1-5: open anocracy, -5-0: open anocracy, and -10 to -6: autocracy. The average democracy index is 5.8.
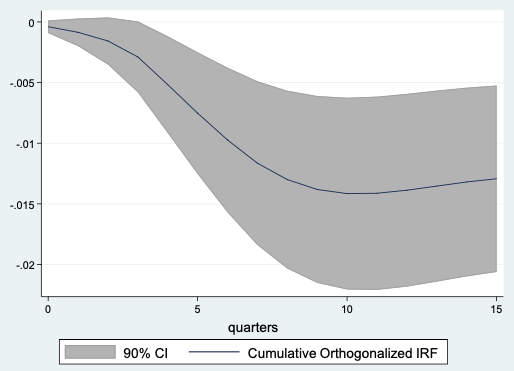
5. Increases in the WUI foreshadow significant declines in output. This is shown in Figure 5, which runs a standard panel-VAR estimation on GDP growth on shocks to the WUI uncertainty country-level index.
Figure 5 GDP response to WUI innovations, 1996-2013
Source: Ahir et al. (2018).
Note: VAR fit to quarterly data for a panel of 46 countries from 1996 Q1 to 2013 Q2. Impulse responses of GDP to a one-standard deviation increase in the WUI – equal to the change in average value in the index from 2014 to 2016 – based on a Cholesky decomposition with the following order: the log of average stock return, the WUI and GDP growth. The specification includes four lags of all variables. Country and time fixed effects are included.
A valuable dataset
We believe that this dataset can be extremely valuable to researches for many applications.
- First, since innovations in the WUI foreshadow significant declines in output, the WUI could be used as an alternative measure of economic activity when these are not available (such as quarterly GDP for many countries).
- Second, the dataset can be used to examine the impact of differences in the level of uncertainty across countries on key macroeconomic outcomes.
- Third, the broad country coverage allows us to tackle important research questions so far not explored because of data limitations, such as the role played by institutions and regulations in affecting uncertainty and shaping the response of economic variables to uncertainty shocks.
References
Ahir, H, N Bloom, and D Furceri (2018), “World Uncertainty Index”, Stanford mimeo.
Baker, S R, N Bloom, and S J Davis. (2016), “Measuring Economic Policy Uncertainty”, The Quarterly Journal of Economics 131(4): 1593–1636.
International Monetary Fund (2018), World Economic Outlook, October 2018, IMF.
Pastor, L and P Veronesi (2017), “Explaining the puzzle of high policy uncertainty and low market volatility”, VoxEU.org,25 May.
