The US has run its largest world trade deficit ever in the last several decades. In 2015, it recorded a $745 billion trade deficit in goods. Deteriorating domestic savings is widely accepted as the main reason for the US trade deficit’s continuing rise (Frankel 2009). To a certain extent, however, outdated trade statistics, which are inconsistent with trade dominated by global value chains (GVCs), are responsible for the rising deficit. Conventional trade statistics only measure the value of physical goods crossing national borders. With the proliferation of GVCs, more and more US multinationals have specialised in brand marketing and technological innovations, and outsourced product manufacturing and assembling to foreign companies. They no longer manufacture any physical goods, but sell foreign consumers the value added of their intellectual property embedded in the products assembled or manufactured in foreign countries.
When US multinationals sell products not manufactured in the US, there are no physical goods crossing the border of the US. These multinationals generally capture the highest proportion of total value added of the products sold in the global market because they monopolise the brands and technologies attached with the products. However, the value added obtained by US multinationals is not included in the trade statistics of any countries. In terms of income generating, the export of the value added of intellectual property has the same function as the exports of physical goods, such as grains and cars. Therefore, current trade statistics are inconsistent with trade dominated by GVCs. A substantial portion of US exports is missing from trade statistics. Actual exports of American companies are underestimated, and at the same time the US trade deficit is exaggerated.
The concept of trade in value added has been emphasised by Xing and Detert (2010), OECD and WTO (2013) and Koopman et al. (2014). The value added as analysed in all those studies is included in trade statistics. The value added of intellectual property embedded in individual products available in the global market is generally not included in any trade statistics.
The iPhone’s overseas sales and the missing export
To illustrate how trade statistics fail to record the export of intellectual property, I use the case of Xing and Detert (2010). When Apple sells a $500 iPhone to a foreign consumer, it sends the sale order to Foxconn in China. For assembling the iPhone, Foxconn imports $172.46 worth of parts and components, of which $10.75 comes from the US. When the ready-to-use iPhone leaves China, China’s customs records a $178.96 export for the country. As a result, the sale of a $500 iPhone gives rise to a total $351.42 export for all countries involved in the value chain of the iPhone. It is important to emphasise that only $10.75 of the total export is recorded as a US export (Figure 1).
Figure 1 Sale of an iPhone abroad and corresponding trade flows
Source: Xing (2017)
From the transaction, Apple receives $321.04 for the value added of its brand and technology imbedded in the iPhone. It represents the export of Apple intellectual property. But, $321.04 is recorded neither in US export in goods nor in services. This is a large missing export of Apple intellectual property associated with selling one iPhone abroad! The iPhone trade unambiguously demonstrates that conventional trade statistics only capture the value of physical goods crossing borders and fail to trace the export of the value added of intellectual property. This analysis is based on a 3G iPhone. The replication of the analysis with the most recent models of iPhones would yield identical conclusions.
Apple’s overseas sales and the missing US exports
Apple is the largest consumer products company in the US. It uses GVCs to manufacture and sell its products globally. If the value added Apple obtained from its overseas sales were included in the exports of the US, the deficit of the US would decrease significantly. In 2015 the net foreign sales of Apple amounted to $139.8 billion, which contributed almost nothing to the figure of US exports since all Apple products are assembled in and shipped from China to international markets. It is estimated that the value added of Apple’s intellectual property accounted for $55.9 billion of the foreign net sales. Compared with the exports of the US in 2015 and its trade deficit, the value added of Apple’s intellectual property is equivalent to 3.7% of US exports and 7.5% of its trade deficit. In other words, if the value added of Apple were included, US exports would rise by 3.7% and the trade deficit would fall by 7.5% (Table 1).
Table 1 US exports and Apple’s overseas sales (billions of US dollars)
Source: Xing (2017).
Apple’s overseas sales and the US’ bilateral trade balances
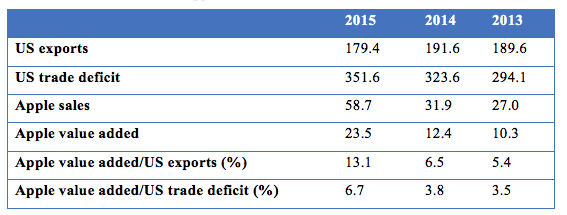
If the value added of Apple were included as part of the US’ exports, it could also greatly modify its bilateral trade imbalances. Chinese consumers’ passion for trendy Apple products has turned China into the largest foreign market for Apple. Its net sales in Greater China (including mainland China, Hong Kong, Taiwan and Macau) surged to $58.7 billion in 2015. Until now, all Apple products have been assembled in factories located in China. No matter how many billion dollars of products are sold there by Apple, the US customs simply cannot even add one dollar to the US exports to the region.
It is estimated that Apple captured $23.5 billion from the sales in Greater China. While made-in-China T-shirts sold in the US market are recognised as part of China’s exports to the US, Chinese consumers’ payment for the value added of Apple is not recorded as part of the US export to China. Unambiguously, this asymmetric recording has distorted the true picture of the bilateral trade balance. If the value added of Apple were included in US exports to the region, US exports to Greater China would rise by 13.1% and its trade deficit with the region would decrease by 6.7%. It is noteworthy to mention that the changes are due to just one American company, namely, Apple. Many US multinationals operate in the same fashion. If we included all of the value added that US multinationals derive from their intellectual property in China as part of the US exports to China, the trade between the two countries would be much more balanced than is indicated by current trade statistics.
Table 2 US trade with and Apple’s sales in Greater China* (billions of US dollars)
Note: * Greater China includes mainland China, Taiwan, Hong Kong and Macau.
Source: Xing (2017).
Similarly, the value added Apple gained in the Japanese market could lower the trade imbalance between Japan and the US. In 2015, Japan’s trade surplus with the US totalled $69 billion. Japanese automobile exports accounted for most of this surplus. When Japanese auto makers ship their cars from Japan to the US, all of the cars are declared with the US customs and automatically recorded as a US import from Japan, eventually becoming part of the US trade deficit with Japan. On the other hand, all Apple products sold in Japan are exported from China and apparently have nothing to do with the US. This asymmetric reporting artificially widens the trade imbalance between the two countries. In 2015 Apple’s net sales in Japan amounted $15.7 billion. According to my estimation, Apple’s value added accounted for $6.3 billion of the sales, equivalent to 10.1% of US exports to Japan and 9.1% of the trade deficit with Japan. Therefore, including Apple’s value added could mitigate the bilateral imbalance significantly (Table 3).
Table 3 US trade with and Apple’s sales in Japan (billions of US dollars)
Source: Xing (2017)
The case of Apple is not unique. Nike, a US company with about one third of the global sports shoe market, “concentrates on the ‘D’ (develop) and ‘S’ (sell) rather on the ‘M’ (make) and ‘B’ (buy)” (Kaplinsky 2000). In 2015, its foreign sales amounted to $16.4 billion, with a 46% gross profit margin. In the Greater China region, Nike achieved $3.1 billion sales. Similar to the case of Apple, the value added Nike derived from overseas markets does not contribute a cent to the figure of US exports under current trade statistics.
The failure of trade statistics in capturing exported value added of intellectual property has widened the US trade deficit and the bilateral imbalances with China and Japan. Incorporating the value added of US multinationals’ intellectual property into the exports of the US would make the global trade system more balanced than it appears to be. Reforming trade statistics by including the value added of intellectual property embedded in products assembled or manufactured abroad is an essential step towards a better understanding of how trade benefits all countries involved, in particular countries specialising in exporting intangible intellectual property.
References
Frankel, J (2009), “Eight Reasons We Are Given Not to Worry About the US Deficits,” Working paper No. 58, the Commission on Growth and Development.
Kaplinsky, R (2000), “Spreading the Gains from Globalization: What Can Be learned from Value Chain Analysis,” IDS working paper 110.
Koopman, R, Z Wang and S Wei (2014), “Tracing Value-Added and Double Counting in Gross Exports,” American Economic Review 104(2): 459-94.
OECD and WTO (2013), “Trade in Value-added: Concepts, Methodologies and Challenges,” Joint OECD-WTO Note.
Xing, Y (2017), “Global Value Chains and the Missing Exports of the US,” GRIPS Discussion Papers 17-06, National Graduate Institute for Policy Studies, Tokyo, Japan.
Xing, Y and N Detert (2010), “How the iPhone Widens the US Trade Deficit with PRC,” ADB Institute working paper No. 257.


