The economic literature has since long recognised that firm-level data deliver crucial information for understanding aggregate competitiveness, as aggregate performance depends strongly on firm-level decisions. Moreover, widespread heterogeneity in firms’ behaviour is by now well recognised both in academic and policy circles, highlighting the limits of models based on the representative agent hypothesis (Caves 1998, Bartelsman and Doms 2000, Melitz and Redding 2014, Altomonte et al. 2011). For these reasons there is growing demand from academia and policy institutions for cross-country comparable firm data. CompNet was created in 2012 to provide such resources and to serve as a hub for economists interested in better understanding the drivers of competitiveness. This is the bottom line of the CompNet Dataset, now at its 6th edition, which is compiled following a micro-distributed approach (Bartelsman et al. 2004) and provides micro-aggregated indicators of productivity, employment, competition and financial position of firms for a large set of countries and sectors – all of this of course done using the best proprietary data available to the 20 EU country expert teams associated to the project. The result is a huge amount of information on the economic structure of major EU countries, which takes fully into account that firms are heterogeneous.
What does the dataset tell us? Among the hundreds of variables and joint distributions contained in the dataset (soon to be made available upon request also to researchers external to the network), we have selected three stylised facts or applications drawing from the latest CompNet cross-country report (Lopez-Garcia et al. 2018). Although correlations obviously do not imply causation, some of these new facts can certainly stimulate curiosity for avid researchers or inspiration for policy makers.
Application 1: Do distressed firms have a sizeable economic impact?
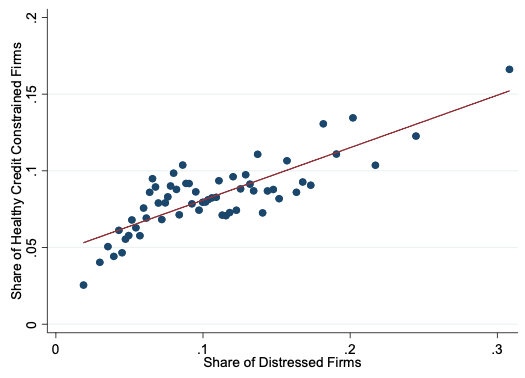
The existence of ‘distressed firms’ represents a potential source of inefficiency within an economy, since these can hold back productive resources (e.g. credit) which could be otherwise reallocated to more productive entities (Schivardi et al. 2017, Gopinath et al. 2017). For the first time, the CompNet dataset includes information on such firms, defined as firms reporting negative or positive operating profits but lower than interest payments for three consecutive years, as in McGowan et al. (2017). Using the CompNet dataset, it is possible to show that in country-sector-years with a high share of distressed firms, defined here as firms with persistent negative profits excluding high-growth firms, healthy firms are more likely to be credit constrained (Figure 1).
Figure 1 Share of distressed firms and credit constrained healthy firms in the same sector
Source: 6th vintage of CompNet, full sample.
Notes: the share of credit constrained firms is measured according to the CompNet ICC indicator of credit constraints (see Ferrando et al. 2015). The countries included are: BE, HR, DK, FI, FR, HU, IT, LT, NL, PL, PT, RO, ES, SI and SE. The figure is a “bin-scatter”, that is, it groups observations in bins, both in the x- and y-axis, to show a cleaner picture. Country-specific fixed effects are controlled for to take away country-invariant factors which could affect the correlation.
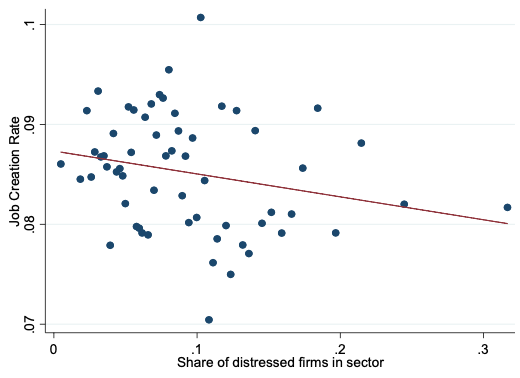
Turning next to the economic impact of distressed firms, Figures 2 and 3 show that there is a negative correlation between shares of distressed firms in a given country-sector-year and, respectively, the corresponding median investment ratio and job creation rate for 14 EU countries.
Figure 2 Share of distressed firms and sector investment
Figure 3 Sector job creation rate and share of distressed firms
Source: 6th vintage of CompNet, full sample.
Notes: Distressed firms defined as firms with interest payments higher than operating profits for 3 consecutive years, conditional on positive profits. The investment ratio is defined as the growth rate of capital plus depreciation, divided by capital. The figure is a “bin-scatter”, that is, it groups observations in bins, both in the x- and y-axis, to show a cleaner picture. Country-specific fixed effects are controlled for to take away country-invariant factors which could affect the correlation.
Such stylised facts are obviously just initial findings, but could serve as potential motivation for further studies along these lines.
Application 2: Are wage-productivity trends diverging?
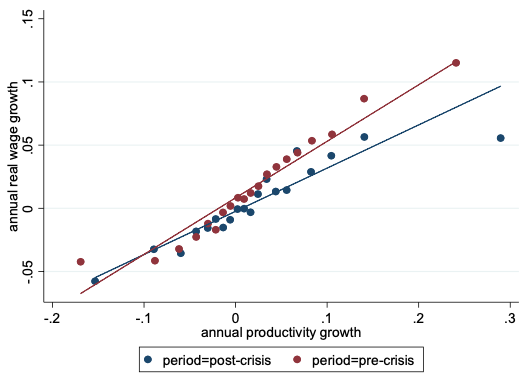
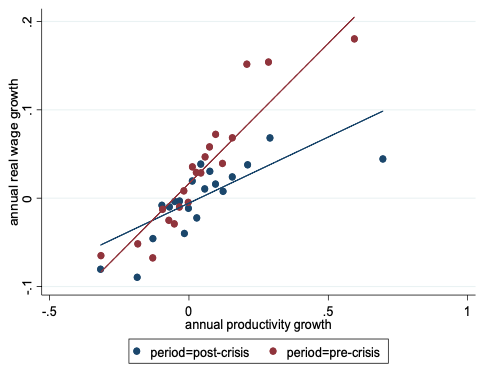
According the recent debate about the rather subdued nominal wage growth in western economies in the post-crisis period, two of the main factors behind this common development identified by policymakers are low inflation and weak productivity growth. However, Figure 4 shows that in the post-crisis period, here defined as 2013-2015, real wage growth was lower than in the pre-crisis period for every level of productivity growth.
Figure 4 Median real wage and productivity growth rate in western economies, pre and post-crisis period
Source: 6th vintage of CompNet, sample of firms with at least 20 employees.
Notes: Countries included are BE, DK, FI, FR, DE, NL, PT and SE over the period 2000-2015. Note that the figure is a “bin-scatter”, that is, it groups observations in bins, both in the x- and y-axis, to show a cleaner picture. Country-specific fixed effects are controlled for to take away country-invariant factors which could affect the correlation.
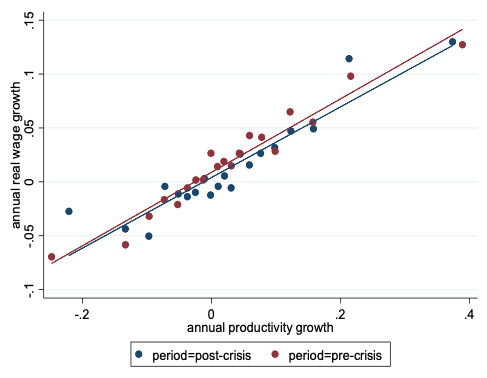
Going more granular, however, CompNet data show that this disconnection between real wage and productivity growth in the post-crisis period has been rather heterogeneous across firms, most notably between the most vis-a-vis the least productive ones.
Figure 5 Median real wage and productivity growth rate in western economies, pre- and post-crisis periods
Top 10% productive firms
Bottom 10% productive firms
Source: 6th vintage of CompNet, 20E sample.
Notes: countries included are BE, DK, DE, FI, FR, IT, NL, PT and SE. Pre-crisis period is 2004-2007 and post-crisis 2013-2015. Note that the figure is a “bin-scatter”, that is, it groups observations in bins, both in the x- and y-axis, to show a cleaner picture. Country-specific fixed effects are controlled for to take away country-invariant factors which could affect the correlation.
Figure 5 (top panel) shows that the pass-through from productivity to wage growth has remained virtually unchanged before (in red) and after the crisis (depicted in blue) for the 10% top productive firms within each 2-digit sector; such pass-through, instead, has remarkably changed before and after the crisis for the firms at the bottom of the productivity distribution. What is the reason for that? At this stage we can only conjecture that the crisis may have generated a shift towards lower payed jobs particularly in low-productive firms during the crisis and the post-crisis period. Clearly, these results deserve additional and specific research, which will take into account the economy’s micro-structure.
Application 3: How happy are the ‘happy few’?
The early work of Mayer and Ottaviano (2008) defines as the ‘happy few’ as those firms which are able to overcome existing fixed and variable costs of exporting, and thus are the only able to export. These firms are significantly different (i.e. more productive) than other firms operating in the same industry. The question here is: how happy are the happy few in Europe?
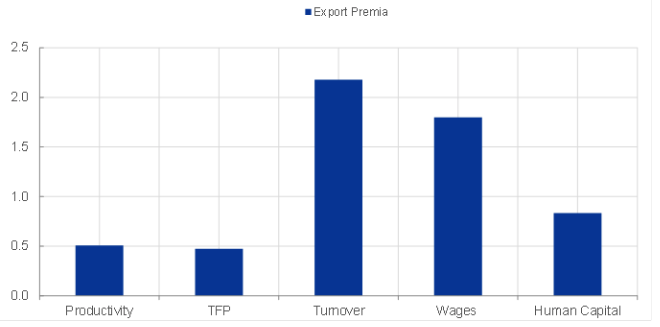
Figure 6 Performance premia of exporting firms over domestic firms in the same 2-digit industry
Source: 6th vintage of CompNet, full sample.
Notes: The chart shows the coefficients of the export dummy, indicating whether the firm is exporter or not (reference category), from OLS regressions where the dependent variable is the log of the performance indicators, controlling for country, time and sector dummies. Countries included are FI, HR, IT, LT, SE and SI.
To start responding to the question, we use the CompNet dataset to plot the performance premia of exporting firms relative to non-exporting ones in the same narrowly defined industry on a number of dimensions. Figure 6 shows that exporting firms are more productive (around 50% more), larger (in terms of employees or turnover,) pay higher wages, and employ more qualified personnel (human capital). This is the first time that the CompNet dataset includes a proxy for qualification of the workers, measured by the difference between the average wages paid by a firm over the median wage paid by all other firms in the same 2-digit industry.
Conclusions
Policymakers and institutions are increasingly demanding available granular data in order to complement their macro-analysis of aggregated indicators with the understanding of underlying micro-trends and foundations. The CompNet project has the explicit objective to fill this gap and to make benchmark analysis of competitiveness more effective. Over the years the dataset has improved its country coverage and compiled indicators. Most importantly, resources have been invested in improving cross-country comparability. In particular, the 6th vintage of data comes with a detailed report analysing the metadata and comparability issues in order to provide the required information for researchers and to correct remaining biases.
By innovatively exploiting the rich cross-country micro-aggregated data sourced from CompNet, it is possible to deepen the understanding of important economic facts and produce relevant as well as consistent policy and research work. External researchers are encouraged to make use of it.
References
Altomonte, C, G Barba Navaretti, F di Mauro and G Ottaviano (2022), "Assessing competitiveness: how firm-level data can help", (with Carlo Altomonte, Giorgio Barba Navaretti and Gianmarco Ottaviano), Bruegel Policy Contribution 2011/16.
Bartelsman, E J and M Doms (2000), “Understanding Productivity: Lessons from Longitudinal Microdata”, Journal of Economic Literature 38: 569-594.
Bartelsman, E, J Haltiwanger and S Scarpetta (2004), "Microeconomic evidence of creative destruction in industrial and developing countries", World Bank Policy Research Working Paper No. 3464.
Caves, R E (1998), “Industrial Organization and New Findings on the Turnover and Mobility of Firms”, Journal of Economic Literature 36: 1947-1982.
Ferrando, A, M Iudice, C Altomonte, S Blank, M H Felt, F Meinen, K Neugebauer and I Siedschlag (2015), “Assessing the financial and financing conditions of firms in Europe: the financial module in CompNet”, ECB Working Paper 1836.
Gopinath, G, Ş Kalemli-Özcan, L Karabarbounis and C Villegas-Sanchez (2017), “Capital allocation and productivity in South Europe”, The Quarterly Journal of Economics 132(4): 1915-1967.
López-Garcia, P, D Aglio, R Bräuer, P Haug, J P van der Kerke, M Mertens, M Sartori, R Serafini, A C Soares and A Zona Mattioli (2018): “CompNet’s 6th vintage of data: Novelties and main stylised facts”, The Competitiveness Research Network.
Mayer, T and G I P Ottaviano (2008), “The Happy Few: The Internationalisation of European Firms”, Intereconomics 43(3): 135–148.
McGowan, M A, D Andrews and V Millot (2017): “The Walking Dead? Zombie Firms and Productivity Performance in OECD Countries”, Economics Department Working Paper No. 1372.
Melitz, M J, and S J Redding (2014): “Heterogeneous Firms and Trade”, Handbook of International Economics, 4th ed., 4: 1-54.
Schivardi, F, E Sette and G Tabellini (2017): “Credit Misallocation During the European Financial Crisis”, Bank of Italy Working Paper No. 3/2017.


