Spanish GDP grew at an average rate of 3.5% per year during the expansion of 1995–2007. However, as first noted by Conesa and Kehoe (2016), this growth did not stem from productivity gains, but from the pure accumulation of capital and labour. In fact, aggregate productivity declined at a yearly rate of 0.7%, in sharp contrast with the rest of Europe, where productivity grew by 0.4% per year.
Why did productivity behave so poorly in Spain during the boom years? Conventional wisdom blames it on different forms of a ‘financial resource curse’ due to the entry of Spain to the Economic and Monetary Union. Benigno et al. (2015) argue that the large entry of cheap capital resulted in a misallocation of resources towards low-productivity sectors, in particular construction. Along these lines, Diaz and Franjo (2016) also emphasise the increase in construction, but blame it on the myriad of public sector subsidies and contracts. Fernandez-Villaverde et al. (2013) suggest that the capital inflows generated exceptional returns, making it difficult for banks to screen between different investment projects, which worsened the allocation of capital across firms. Finally, Gopinath et al. (2015) argue that the sharp fall in interest rates produced a deterioration of allocative efficiency across firms because financial frictions resulted in firms accumulating capital at different speeds.
Our recent paper presents three facts pointing to an alternative explanation (García-Santana et al. 2016). The fall in aggregate productivity was indeed due to the increase in misallocation of resources between firms in all sectors, but this problem was especially severe in those industries where the influence of the public sector is more important to success. Worries about corruption are large in Spain and arguably responsible for the hung parliament that emerged in the elections of December 2015. However, estimates of the macroeconomic costs of corruption are scarce, and limited to developing economies when available (e.g. Khwaja and Mian 2005). Our results show that the connections between firms and public officials may have cost at least a 0.3% TFP growth per year in Spain over the 1995–2007 period.
Fact 1: Aggregate data
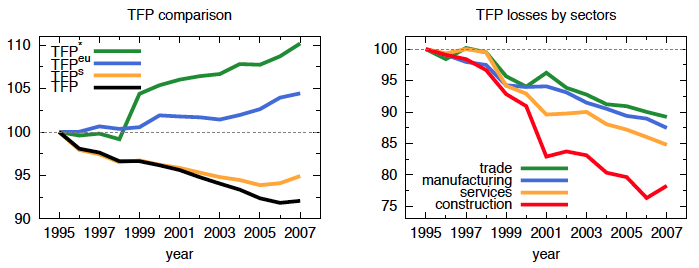
The left panel of Figure 1 shows the well-known result of TFP decline in Spain between 1995 and 2007 (black line), compared to the increase in the EU (blue line). One potential reason behind the decline in TFP is the movement of resources from high productivity sectors to low productivity sectors, for example construction. The empirical evidence, however, is not consistent with this hypothesis. The yellow line in the left panel of Figure 1 plots a counterfactual TFP keeping the share of the 5 largest sectors constant to their value in 1995. Absent the reallocation of resources across sectors, aggregate productivity would have fallen by 0.4% per year, which is only slightly better than the actual fall.
Figure 1 Total factor productivity comparison and losses
Fact 2: Firm-level data
Given that reallocation of resources across sectors accounts only for a small portion of TFP decline during 1995-2007, we are left with the hypothesis of a worsening in the allocation of resources across firms within sectors. To investigate this, we use firm-level administrative data (Central Balance Sheet Data or Central de Balances Integrada (CBI) in Spanish) of around 350,000 firms per year in manufacturing, construction, trade, and services for the period 1995-2007. Slicing the data into 518 4-digit industries, we document two patterns.
First, the within-sector dispersion of productivities across firms increased sharply during the expansion. In a frictionless economy we should observe no dispersion in firm-level revenue productivities within each industry – high productivity firms would expand attracting more capital and workers, which in turn would diminish their revenue productivity (because of either decreasing returns to scale or downward-sloping demand curves). Hence, dispersion of revenue productivities across firms is a symptom of a poor allocation of resources across firms. This is the idea behind the methodology by Hsieh and Klenow (2009), who estimate the disparity in efficiency levels between India, China, and the US, with firm-level data.
Our evidence implies that, had misallocation remained at its level in 1995, Spanish TFP would have grown 0.8% per year. This counterfactual series is plotted in the left panel of Figure 1 (green line) alongside observed TFP in Spain (black line) and in Europe (blue line). This result means that technological progress did not come to a halt in Spain, but capital and labour were not assigned efficiently to the best projects within each sector. In the right panel of Figure 1 we can see that the productivity losses stemming from misallocation were largest in construction (red line), but also important in services (yellow line), manufacturing (blue line), and trade (green line). The increase in misallocation within manufacturing is also documented by Crespo and Segura-Cayuela (2014) and Gopinath et al. (2015) with Amadeus data.
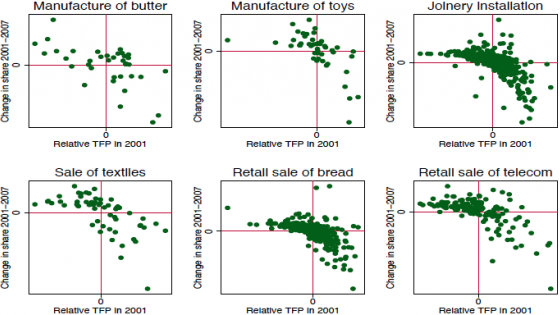
Second, firms’ growth during this period was inversely related to initial productivity. That is, during the boom years, low productivity firms were assigned more capital and labour than high productivity firms. As a result, the former outgrew the latter. Figure 2 displays this pattern for a selection of six industries, but this result is widespread across most industries. Following Foster et al. (2006) industry productivity growth can be decomposed into:
- Firms’ productivity growth weighted by size;
- Firms’ size growth weighted by productivity;
- A cross-term capturing the interaction between firms’ productivity growth and size growth; and,
- Two extra terms capturing entry and exit.
The pattern documented in Figure 2 illustrates the second component of this decomposition, which turns out to explain the whole fall in industry productivity.
Figure 2 Growth and productivity for six industries
Fact 3: Industry variation
The deterioration of resource allocation across firms was pervasive across all industries, but there was substantial variation among them. We exploit this variation to shed some light on the possible factors behind the increase in misallocation.
We find that heterogeneity in financial dependence, capital structure intensity, skill intensity, tradability, and innovative content were unrelated to changes in allocative efficiency. Likewise, we find that the worsening in allocative efficiency was present across all regions and that regional differences in wage growth or house price growth were uncorrelated with the increase in distortions. These results undermine explanations by usual suspects like financial frictions, dual labour markets, or lack of competition.
On the contrary, we find that sectors that are more prone to cronyism (as measured by the Bribe-Payers Index of Transparency International) experienced misallocation between firms twice as big as the rest. This implies that had the whole economy behaved as the non-crony sectors, productivity growth would have been 0.3% higher per year during 1995–2007. This is a large number, and represents a novel measurement of the potential aggregate costs of cronyism. It does not completely account for the misallocation-related annual productivity loss of 1.1% of Spain with respect to the rest of Europe, but we stress that our measurement of cronyism only captures variation across sectors. It remains to be seen whether more precise measures of cronyism might give larger productivity losses.
Concluding remarks
Will productivity grow in the coming years? Which type of policies could help foster productivity growth in Spain? Understanding the causes behind the poor productivity growth in the boom years is very important to answer these questions. The financial resource curse type of explanation is relatively optimistic – without the effects of Spanish entry to the EMU, there should be no further allocative distortions in the future. Instead, if the poor performance of productivity in the past has its root in a form of crony capitalism, then we should not expect much growth unless serious (political) reforms are undertaken.
References
Benigno, G, N Converse, and L Fornaro (2015) “Large capital inflows, sectoral allocation, and economic performance”, Journal of International Money and Finance, 55: 60–87.
Conesa, J C and T Kehoe (2016) “Productivity, taxes and hours worked in Spain: 1970-2014”, Mimeo.
Crespo, A and R Segura-Cayuela (2014) "Understanding competitiveness", EUI Working Paper MWP 2014/20.
Díaz, A and L Franjo (2016) “Capital goods, measured TFP and growth: The case of Spain”, European Economic Review, 83: 19-39.
Fernández-Villaverde, J, L Garicano and T Santos (2013) “Political credit cycles: The case of the Eurozone”, Journal of Economic Perspectives, 27(3): 145-166.
Foster, L, J Haltiwanger and C Krizan (2006) “Market selection, reallocation, and restructuring in the US retail trade sector in the 1990s”, The Review of Economics and Statistics, 88(4): 748-758.
García-Santana, M, J Pijoan-Mas, E Moral-Benito and R Ramos (2016) “Growing like Spain: 1995-2007”, CEPR Discussion Paper Series 11144.
Gopinath, G, S Kalemli-Ozcan, L Karabarbounis and C Villegas-Sánchez (2015) “Capital allocation and productivity in South Europe”, NBER Working Paper No 21453.
Hsieh, C T and P J Klenow (2009) “Misallocation and manufacturing TFP in China and India”, Quarterly Journal of Economics, 124(4): 1403-1448.
Khwaja, A I and A Mian (2005) “Do lenders favor politically connected firms? Rent provision in an emerging financial market”, Quarterly Journal of Economics, 120(4): 1371-1411


