There once was a decade in US history in which financial innovation led to a sharp rise in the flow of credit to households. Durable goods consumption increased dramatically as household debt climbed to over 100% of GDP. The subsequent economic downturn was tragic, and the severity of the malaise was closely related to the preceding rise in household leverage (see Eichengreen and Michener 2003, Mishkin 1978, and the chart from David Beim at npr.org).
Research has argued that the “drop in consumption resulted from the unique combination of historically high consumer indebtedness and punitive default consequences” (Olney 1999).
While the storyline sounds eerily familiar to our recent past, it in fact describes the decade preceding the onset of the Great Depression. The form of innovation was not subprime mortgages – it was instead instalment loans related to automobile purchases and other consumer durables – but the parallels are striking. Household debt for Americans went over 100% of GDP only twice in the last century, in 1929 and in 2006.
Micro data from 2002 to 2009
The availability of microeconomic data has allowed us to dissect the anatomy of the 2002 to 2009 household credit cycle in ways our colleagues of the 1930s could never have imagined. Our research has shown that:
- The expansion of subprime mortgages was the result of a shift in the supply of credit, and
- This shift in the supply of credit forced up house prices. Our view that the expansion of mortgage credit was responsible for house price growth was very controversial when we first presented our research in late 2007. Since then, it has become the mainstream opinion of regulators, with both the Chairman of the Federal Reserve and the President of the Federal Reserve Bank of New York arguing in its favour. See Bernanke (2010) and Dudley (2010).
Existing homeowners borrowed heavily against the rising value of their homes and defaulted en masse when house prices faltered (Mian and Sufi 2009 and 2010a).
In an analysis of economic patterns across US counties, we show that the rise in household leverage during the credit boom was a very strong predictor of recession severity from 2007 to 2009 (Mian and Sufi 2010b). Counties that experienced the largest increase in household debt before the recession saw larger subsequent increases in unemployment and larger decreases in residential investment and durable consumption.
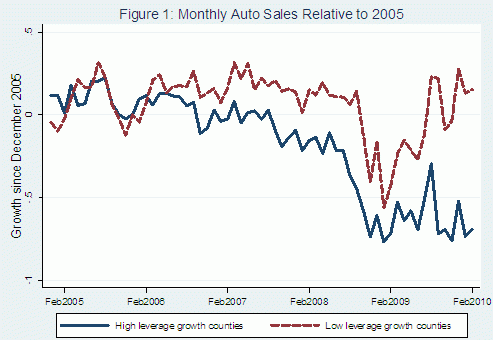
For example, Figure 1 presents the growth in monthly auto sales since December 2005 in US counties with the largest and smallest increase in household debt from 2002 to 20061. The relative decline in auto sales in highly levered counties began as early as the fourth quarter of 2006 (solid blue line), a full year before the official beginning of the recession. In the aftermath of the recession, auto sales have largely recovered in counties with low household debt; however, auto sales remain depressed in highly levered counties even through February 2010. This latter fact ominously portends a difficult path to economic recovery for leveraged counties.
Other research shows a strong link between household debt and recession severity in OECD countries in both the 1990-1991 recession (King 1994) and the current recession (Glick and Lansing 2010). Further, Leamer (2007) argues that eight of the last ten recessions were preceded by substantial problems in housing and durable consumption, leading him to conclude that “housing is the business cycle.” The evidence is overwhelming that the rise in household debt is closely related to the severity of subsequent economic downturns.
The close link between household debt and the severity of the recession provides support to a key policy lesson. Regulators must appreciate the role of leverage in understanding asset price movements and macroeconomic fluctuations. Both researchers (Geanokoplos 2009) and regulators (Dudley 2010) have called for a closer monitoring of leverage ratios associated with all asset classes through the economic cycle.
We are in broad agreement with this lesson, but we believe our research helps refine the policy prescription on two dimensions.
- First, while leverage-induced asset price growth may be important across asset classes, the detection of debt-driven house price growth is particularly important given its effect on real economic activity. During the boom, homeowners borrowed heavily against the rise in home equity which lowered savings rates and likely boosted consumption in the short run. During the bust, house price declines in combination with high household debt levels have lead to a serious drag on the economy. Housing plays a special role in the economy which warrants even closer investigation of housing-related debt levels.
- Second, spotting debt-driven asset price bubbles is easier said than done. Indeed, it has been notoriously difficult for regulators to spot asset price bubbles in real time. For example, during the peak of the housing boom in 2005, top regulators justified house price growth by emphasising labour productivity gains.
A major advantage of our research approach is its reliance on microeconomic data. An analysis of the micro data can help detect the underlying causes of asset price movements, especially in housing markets. For example, our analysis of zip code-level data showed that as early as 2004, mortgage credit growth and house price growth became completely divorced from underlying borrower income growth. Areas with a large fraction of subprime borrowers experienced a sharp increase in house price growth despite having lower employment and earnings patterns.
Concluding remarks
While these correlations are not bullet-proof evidence of a housing bubble, they demonstrate that house price growth was being driven by mortgage credit growth, not fundamental economic improvements. Regulators were unable to detect the disassociation of house price growth and income growth with aggregate data, which would have been obvious had they examined the micro data.
In 1933, Irving Fisher articulated the view that “over-investment and over-speculation are often important, but they would have far less serious results were they not conducted with borrowed money” (Fisher 1933). Having experienced another severe downturn that was preceded by a sharp rise in household debt, we have yet another episode that supports Fisher’s view.
Going forward, policymakers and regulators should appreciate the role of household debt in asset price movements and macroeconomic fluctuations, and they should complement their existing models with rigorous microeconomic analysis.
References
Bernanke, Ben (2010), “Monetary Policy and the Housing Bubble”, Speech at the American Economic Association.
Dudley, William C (2010), “Asset Bubbles and the Implications for Central Bank Policy,” Speech at the Economic Club of New York.
Eichengreen, Barry and Kris Mitchener (2003), “The Great Depression as a Credit Boom Gone Wrong”, BIS Working Paper 137, September.
Fisher, Irving (1933), “The Debt-Deflation Theory of Great Depressions”, Econometrica, 337-357.
Geanakoplos, John (2009), “The Leverage Cycle”, Working Paper, Yale University.
Glick, Reuven and Kevin Lansing (2010), “Global Household Leverage, House Prices, and Consumption”, FRBSF Economic Letter, January.
King, Mervyn (1994) “Debt deflation: Theory and evidence”, European Economic Review, 38:419-455.
Leamer, Edward E (2007), “Housing is the Business Cycle”, NBER WP 13428.
Mian, Atif R and Sufi, Amir (2009), “The Consequences of Mortgage Credit Expansion: Evidence from the US Mortgage Default Crisis”, Quarterly Journal of Economics, 124:1449-1496.
Mian, Atif R and Sufi, Amir (2010a), “House Prices, Home Equity-Based Borrowing, and the US Household Leverage Crisis”, NBER WP 15283.
Mian, Atif R and Sufi, Amir (2010b), “Household Leverage and the Recession of 2007 to 2009”, IMF Economic Review, June.
Mishkin, Frederic (1978), “The Household Balance Sheet and the Great Depression”, Journal of Economic History, 38: 918-937.
Olney, Martha (1999), “Avoiding Default: The Role of Credit in the Consumption Collapse of 1930”, Quarterly Journal of Economics, 114: 319-335.
1 In Figure 1, high leverage growth counties represent the counties in the top 10% based on the increase in the debt to income ratio from 2002 to 2006. Low leverage growth counties are in the bottom 10% on the same measure.


