Testing is crucial for detecting people with SARS-CoV-2, the virus responsible for the COVID-19 pandemic (Bedford et al. 2020, Binnicker 2020, Fineberg 2020, COVID-19 National Emergency Response Center 2020, Salathé 2020). In this vein, on 16 March 2020, the Director-General of the World Health Organization (WHO) strongly advised countries to “test, test, test” because “a fire cannot be fought blindfolded”.1 But in many countries, tests are too scarce a resource to guarantee widespread and comprehensive testing. Countries have set up guidelines spelling out the priority of who should get tested, given that not all people can be tested. However, this is only one side of the story and does not address the question of how to allocate a limited number of tests across sub-national levels (see Baldwin and Weder di Mauro 2020 for additional economic analyses of the pandemic).
In this column, we present a data-driven and operational criterion that distributes tests according to how the virus spreads during the pandemic, in different geographical units (Baunez et al. 2020). The simple idea of the criterion is to base the allocation decision (of a limited number of tests) on data about the marginal benefit of an additional test. Such marginal benefit can be measured directly based on a function representing the dynamics of the pandemic, which is estimated using data on the numbers of both COVID-19 confirmed cases and total tests.
As a background consideration, an important point of our approach is that it does not rely on a predictive model but rather relates to real-time data analysis. Our data-driven criterion builds upon a non-parametric estimation and, as such, constitutes an important real-time source of information for decision-makers. This method complements traditional epidemiological models and is amenable to public health analysis. The approach organises the data in real time in order to detect whether an ongoing pandemic is accelerating or decelerating. It is based on the idea that in times of radical uncertainty, when it is difficult to have precise estimates of probabilities (and is thus difficult to make reliable forecasting models), decisions should arguably put more weight on the information available in real time. This is most obviously the case when a novel pathogen triggers a pandemic.
The question is then how one can use available information to detect acceleration or deceleration of harm, as in the current case of the pandemic. Harm, in the current context, is first of all the number of deaths or people in intensive care units and hospitals. However, it is also, more generally, the spread of the virus within the wider population. To answer this question the number of tests is crucial. Tests allow for visualising the spread of the pandemic, at least to a certain degree. For example, with an unknown number of asymptotic people, not all positive cases will reliably be captured. Nevertheless, tests are what we have and know, and are a necessary precondition for a reliable real-time analysis of the harm of a pandemic. If ever more cases of infected people are detected with an increasing number of total tests, the pandemic is accelerating. If, on the contrary, ever fewer infected people are detected with an increasing number of tests, the pandemic is decelerating. This insight can be visualised by plotting the cumulated number of cases that have been tested positively against the cumulated number of total tests. The convexity of such a functional relationship indicates acceleration, with concavity corresponding to deceleration. This is an important real-time guide for health policy decisions that aim to curb the pandemic. What health policy decisions want to achieve (and to maintain) is a concave functional relationship of positively tested subjects to total tests, and eventually a flat relationship that indicates the end of the pandemic. Tests may also be an important health policy response to contain the pandemic, but this is not what we are directly discussing here. In this column, testing allows policymakers to know about the pandemic spread, whatever the health policy response in place.
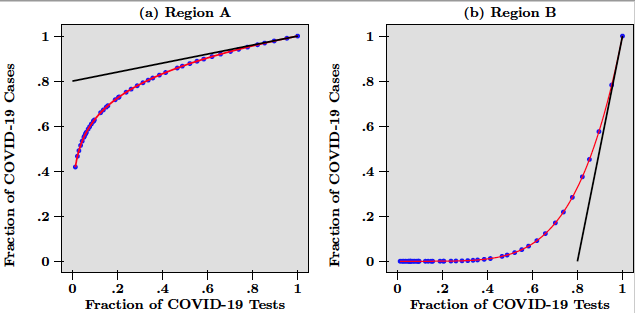
Consider the following example. A hypothetical country has been subject to an epidemic like COVID-19 for several weeks. This country is composed of two regions labeled A and B. While in region A, the virus spread rapidly from very early on, region B only saw a few cases at the beginning but experienced subsequently a rapid increase of infected people. The pandemic has followed different dynamics across the two regions and the resulting heterogeneity is best visualised in Figure 1, which depicts a scatter-plot of the number of COVID-19 tests against the number of COVID-19 cases for hypothetical daily data from the two regions, at a given date that we think of as today (the blue dots).
Figure 1
In Figure 1, the number of cases and the number of tests are normalised by dividing raw data over the last data point available today. The red lines in Figure 1 are the functional relationship between positive cases and total tests and thus represent the dynamics of the pandemic in each region. While in panel (a) this line is concave and indicates that tests find ever fewer infected people, in panel (b) the line is convex and points to the fact that tests find ever more cases of infected people. Put differently, what testing tells us is that while in region A, the pandemic is decelerating. In region B it is accelerating.
In Figure 1, the marginal benefit of a test is measured by the slope of the tangent of each curve at x = 1, which is the end point of each graph. Marginal benefits are depicted as the black lines, tangent to the red curves in panels (a) and (b). Given the steepness of the tangent in panel (b) (due to the acceleration of the pandemic), it is obvious that more tests should be done in region B than in region A. Both curves are the graphs of power function, so that in this example the slope at x = 1 is directly given by the exponent, which equals 0.2 for region A, and 5 for region B. These numbers are interpreted as follows.
In region A, the most recent 10% of the total number of tests have helped uncover 2% (that is, 0.2 x 10) of total confirmed infections. This is much less than in region B, where the most recent 10% are associated with the detection of 50% (that is, 5 x 10) of the total number of COVID-19 cases. In that sense, more testing is needed in region B than in region A. Therefore, given that the marginal benefit of an additional test in region B is 25 (that is, 5/0.2) times higher than in region A, the number of total tests available today should be divided as follows. Region B would get about 96% (that is, 5/5.2), while region A would get the remainder 4% (that is, 0.2/5.2).
It goes without saying that test shares should be updated regularly (given the time-varying nature of the weights defined using our criterion) following changes in the marginal benefits/slopes of some regions relative to others. For example, the allocations derived from the early points in Figure 1 would imply that more tests should go to region A than to region B. Interestingly, our criterion helps with the organisation of the end of general lockdown periods. For instance, our criterion helps ensure that the level of epidemic containment in different geographical areas is close to equal. This situation would deliver equal weights in our analysis. Although the above weights do not consider population in each region, it is straightforward to combine them with population weights, as we did for the analysis of Italian regions described below.
Figure 2
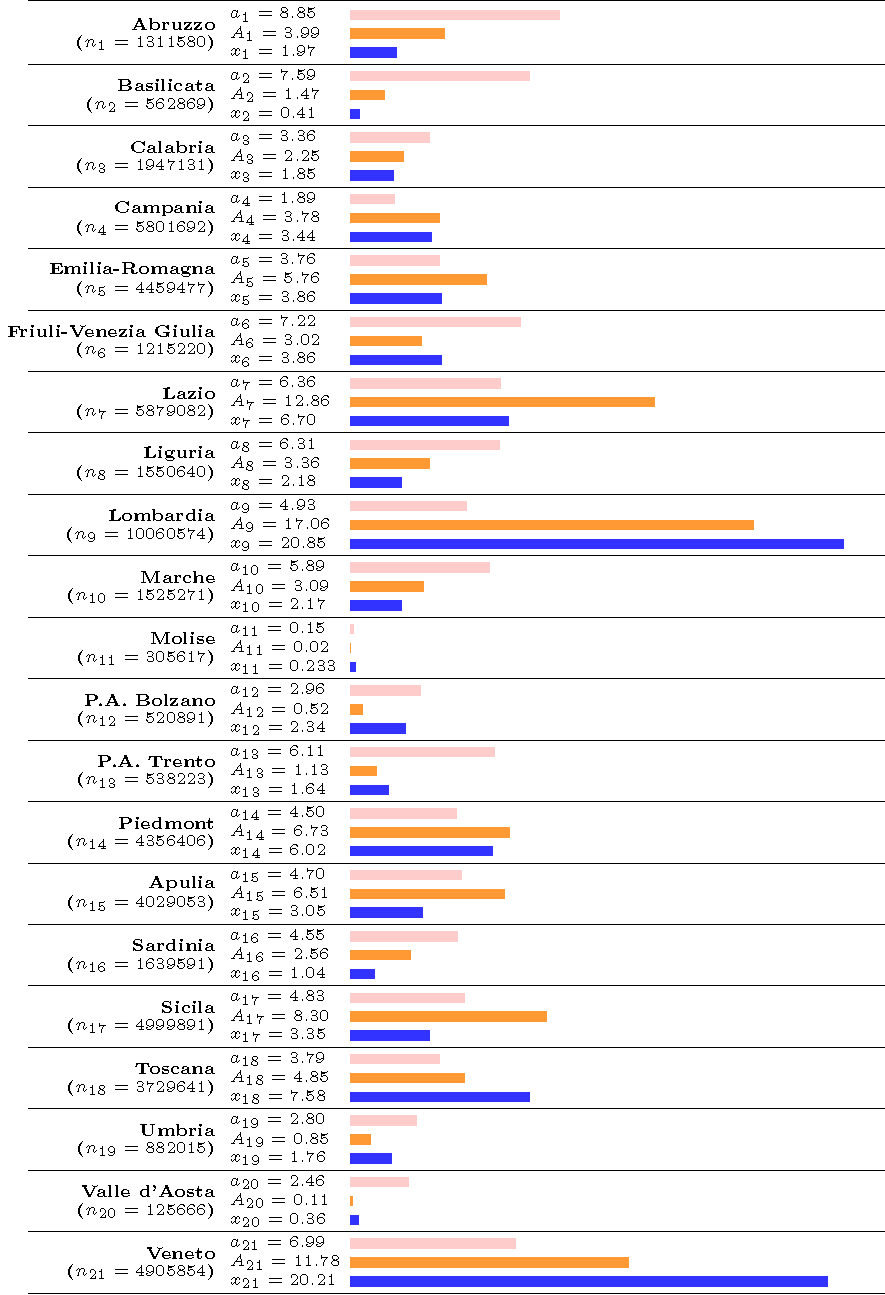
Note: optimal allocations for each region as well as the mean actual allocation of tests in the last three days in each region i = 1,…,21, where xi is real allocation, ni is the number of inhabitants in the region. Weight ai, is the optimal allocation that does not account for population size whereas ai is the optimal allocation that uses population size, that is, Ai = ai * ni. Pink (resp. orange and blue) bar represents the optimal population-unweighted allocation (resp. the optimal allocation weighted by population size and the mean actual allocation).
The data we use is made publicly available by the Italian Department of Civil Protection (Baunez et al. 2020), as of 14 April 2020. There are 20 regions, but the data also include the region of Trentino-Alto Adige which counts for two to take into account the two autonomous provinces (P.A.) that form the region (P.A. Bolzano and P.A. Trento). From this dataset, we use the information on the total number of tests performed (‘tamponi’) and the total number of positive cases (‘totale casi’) for each region, which is updated daily. We estimate non-parametrically both the functional relationship between the total number of tests and the total number of positive cases for each region and its first derivative (by local polynomial regression fitting with Epanechnikov weights). The method allows for the construction of a smooth curve relating tests and cases, without imposing parametric restrictions on the functional form (Harrel 2015).
We report in Figure 2 the estimated (population-unweighted) optimal shares and the (population-weighted) optimal shares, using the mean estimate of the first derivative on the last 2.5% of output design points (see Appendix in Baunez et al, 2020, for detailed results). We also report as a benchmark the mean actual allocation of tests in the last three days of the observed sample, for comparison purpose. In Figure 2, each line represents an Italian region, whose population ni appears in parentheses under the name of the region in the first column. In the second column we report the population-weighted and population-unweighted shares, respectively, Ai and ai , as well as the actual share denoted xi. The third column helps visualizing those shares. As can be seen in Figure 2, differences between the optimal shares as computed by using our (population-weighted and unweighted) criterion and actual shares of tests in all regions are significant.
A striking conclusion is that certain regions have received too many tests, compared to others who have received too little. A substantial share of tests conducted in regions such as Lombardia, Veneto, and Emilia-Romagna (where the pandemic spread more rapidly at the beginning) should now be allocated to other regions. This is particularly true if we consider the population-unweighted share ‘ai' of tests but also if we take the population-weighted share ‘ Ai' into account. However, what also becomes apparent is that Lombardia and Veneto have currently about the same share of total tests allocated (about 20% each), even though Veneto has only about half of the population of Lombardia. Our population-weighted criterion Ai takes this into account and allocates more tests to Lombardia than to Veneto, given its population size. If we continue to focus on the population-weighted share Ai, another striking example are the regions of Lazio and Sicily, which should receive a much larger share of tests, given the number of inhabitants in those regions. Indeed, Lazio (the second most populated region) should receive twice as many tests as it currently does, that is about 13% of the total number of Italian tests. This is because both its marginal benefit of testing and its regional population are among the largest across Italy. Sicily is in a similar situation and should also get twice as many tests as it presently does. Generally, in view of Figure 2, it is hard to conclude that tests have been allocated across Italian regions where they are the most efficient and mostly needed. Obviously, to achieve the goal of efficient distribution of tests, it is important that regional governments and administrations are team-players and a nation-wide coordination is possible.
References
Baldwin, R and B Weder di Mauro (2020), Economics in the Time of COVID-19, VoxEU.org eBook, CEPR Press.
Baunez, C, M Degoulet, S Luchini, P Pintus and M Teschl (2020), “Sub-National Allocation of COVID-19 Tests: An Efficiency Criterion with an Application to Italian Regions”, Covid Economics 12, 1 May.
Bedford J, D Enria, J Giesecke, D L Heymann, C Ihekweazu, G Kobinger, H Clifford Lane, Z Memish, M D Oh, A Alpha Sall, A Schuchat, K Ungchusak, L H Wieler and WHO Strategic and Technical Advisory Group for Infectious Hazards (2020), “Towards Controlling of a Pandemic”, The Lancet S0140-6736(20)30673-5.
Binnicker, M J (2020), “Emergence of a Novel Coronavirus Disease (COVID-19) and the Importance of Diagnostic Testing: Why Partnership between Clinical Laboratories, Public Health Agencies, and Industry Is Essential to Control the Outbreak”, Clinical Chemistry 66(5): 664-666.
COVID-19 National Emergency Response Center, Epidemiology and Case Management Team, Korea Centers for Disease Control and Prevention (2020), “Contact Transmission of COVID-19 in South Korea: Novel Investigation Techniques for Tracing Contacts”, Osong Public Health Research Perspectives 2020 11(1): 60-63.
Fineberg, H V (2020), “Ten Weeks to Crush the Curve”, New England Journal of Medicine 10.1056/NEJMe2007263.
Gollier, C and O Gossner (2020), “Group Testing against Covid-19”, Covid Economics 2.
Harrel, F E (2015), Regression Modeling Strategies: With Applications to Linear Models, Logistic and Ordinal Regression, and Survival Analysis, Springer.
Salathé, M, C L Althaus, R Neher, S Stringhini, E Hodcroft, J Fellay, M Zwahlen, G Senti, M Battegay, A Wilder-Smith, I Eckerle, M Egger and N Low (2020), “COVID-19 Epidemic in Switzerland: on the Importance of Testing, Contact Tracing and Isolation”, Swiss Medical Weekly.
Endnotes
1 https://www.who.int/dg/speeches/detail/who-director-general-s-opening-remarks-at-the-media-briefing-on-covid-19---16-march-2020.


