The development of novel technologies, the degree to which they affect jobs, and the speed with which they spread across regions are key elements in the study of economic growth, inequality, entrepreneurship, and firm dynamics. Many authors have sought to understand whether the benefits from the adoption of new technologies accrue primarily to a few regions, or to society more widely through, for instance, widespread employment growth. While it has long been recognised that innovation is unevenly distributed (e.g. Andrews and Walley 2021, Lychagin et al. 2010), whether such technical progress may be the root cause of the rising income and wealth inequality in the US has been a matter of intense debate (e.g. Katz and Murphy 1992, Goldin and Katz 2009, Autor et al. 2008, Piketty and Saez 2013, Song et al. 2019). Policymakers have competed intensely to build regional technology clusters in an effort to attract innovative activity and jobs (Bai et al. 2021).
One key obstacle to studying these issues is that it has proven difficult to measure the development and spread of multiple technological advances in a single framework, and to separate those innovations that affect businesses from those that do not. While technology-specific studies may yield many valuable insights, such as studying specific innovations like broadband, AI or robots, it may be hard to generalise these findings. In our recent work (Bloom et al. 2021), we introduce a new approach that allows us to look systematically at a wide variety of technologies. Specifically, we use the full text of millions of patents and job postings and hundreds of thousands of earnings conference calls over the past two decades. By intersecting the text from these three sources, we are able to trace mentions of disruptive innovations from their original patents to the conversations of executives and investors at large firms, and finally to job postings that advertise positions involved with using or producing these technologies. Using this approach, we are able to determine which innovations or sets of innovations (‘technologies’) affect businesses, trace these back to the locations and firms where they emerged, and track their diffusion through jobs advertised in different regions, occupations, and industries over time. Some of the most prolific disruptive innovations we identify are ‘mobile devices’, ‘machine learning’, and ‘cloud computing’.
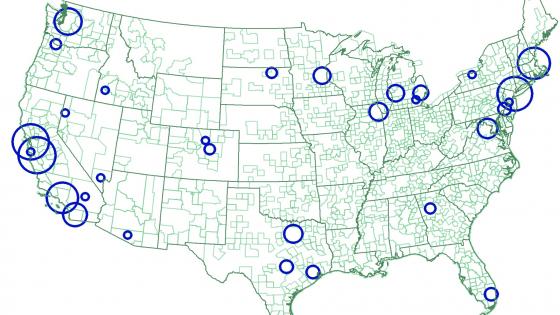
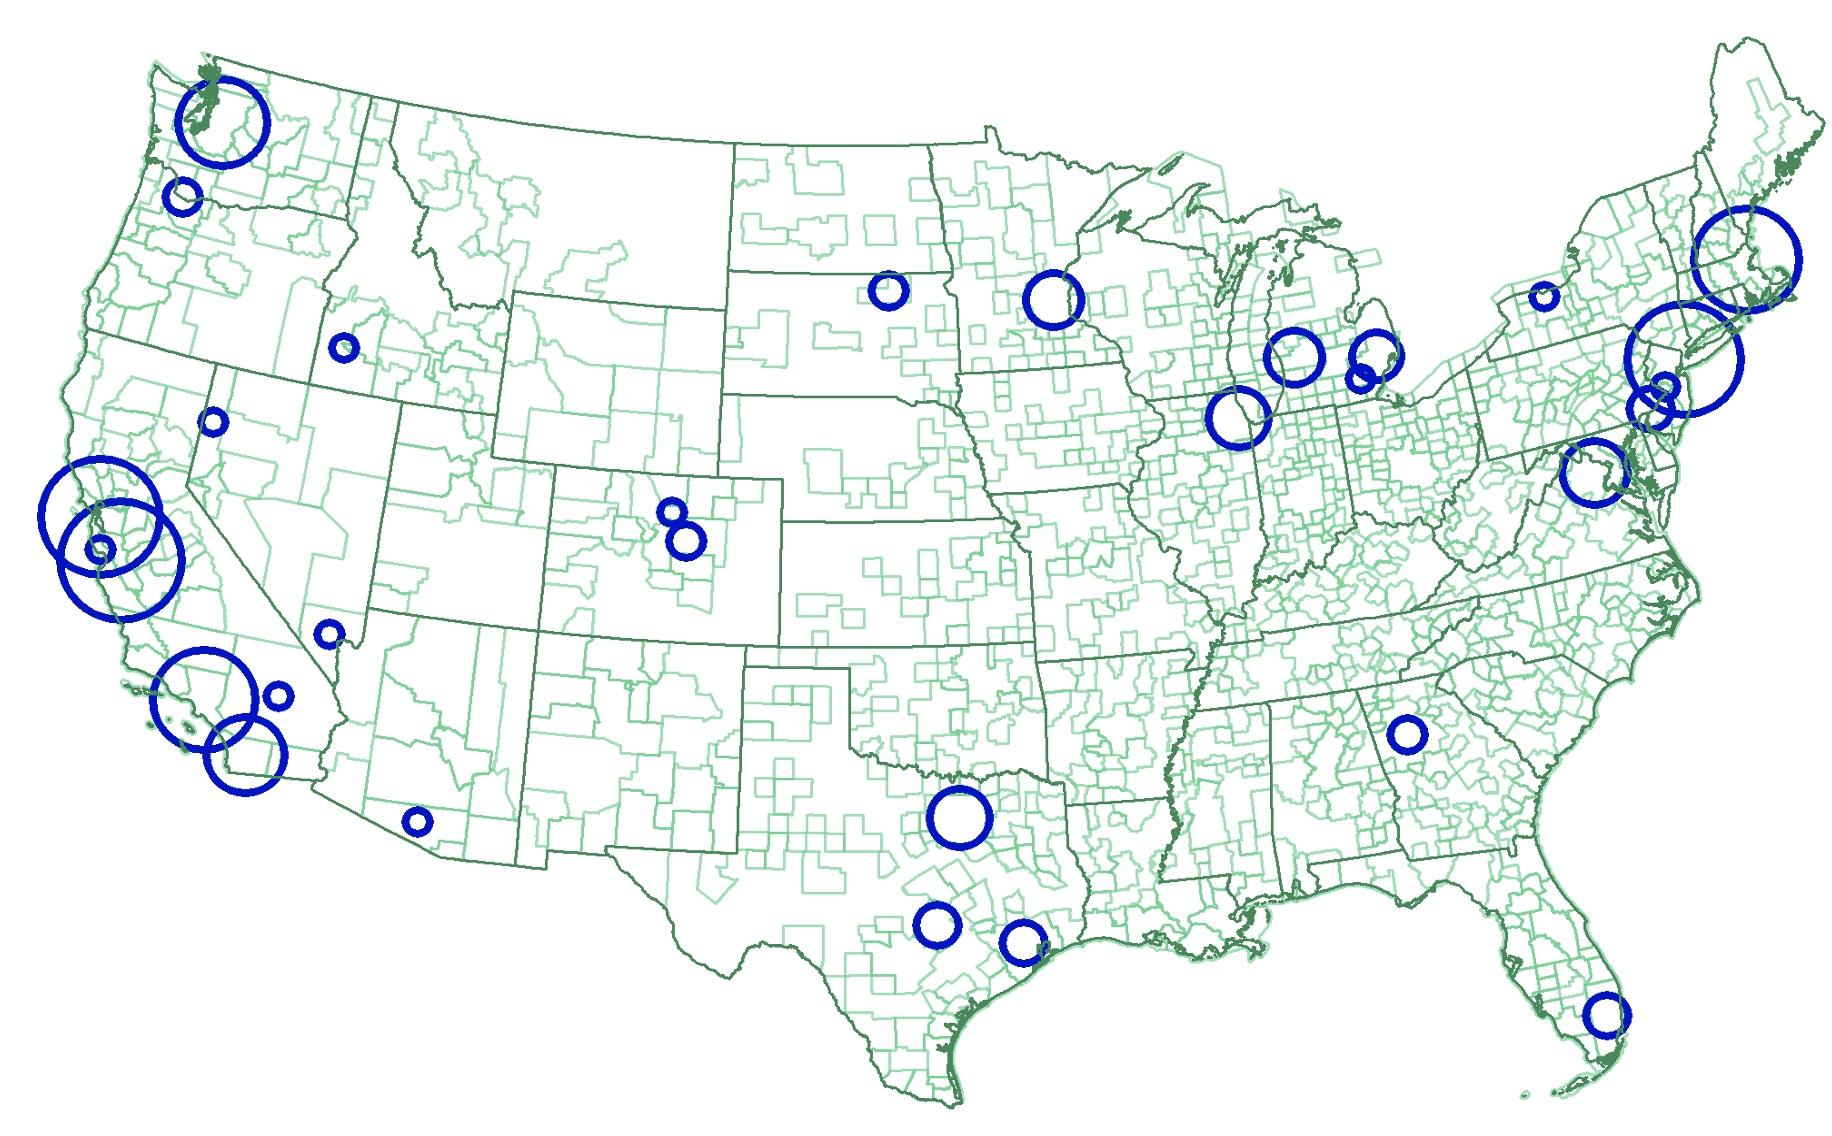
A major focus of our work to date has been on the spread of disruptive technologies across regions. Figure 1 examines the locations where disruptive technologies develop on a US map. We find that the distribution of pioneer locations across technologies is remarkably skewed – i.e. a few super-clusters are the birthplace of a surprising number of the disruptive technologies in our data. Collectively, locations in California alone host a remarkable 40.2% of our technology-pioneer location pairs. Another super-cluster along the Northeast Corridor from Washington to Boston accounts for additional 21.2%. More broadly, the geographic distribution of patenting related to our 29 disruptive technologies is even more skewed than that of patenting in general.
Figure 1 Pioneer locations
Notes: The figure shows, for disruptive patents (in red) and overall patents (in blue), the normalized share of patenting for top 20 CBSAs. Normalized share of patents for a CBSA is defined as the share of total patents filed by US inventors in the CBSA (between 1992 and 2016) divided by the share of U.S. population in the CBSA (as of 2015). The figure is sorted by largest to smallest normalized share of disruptive patenting.
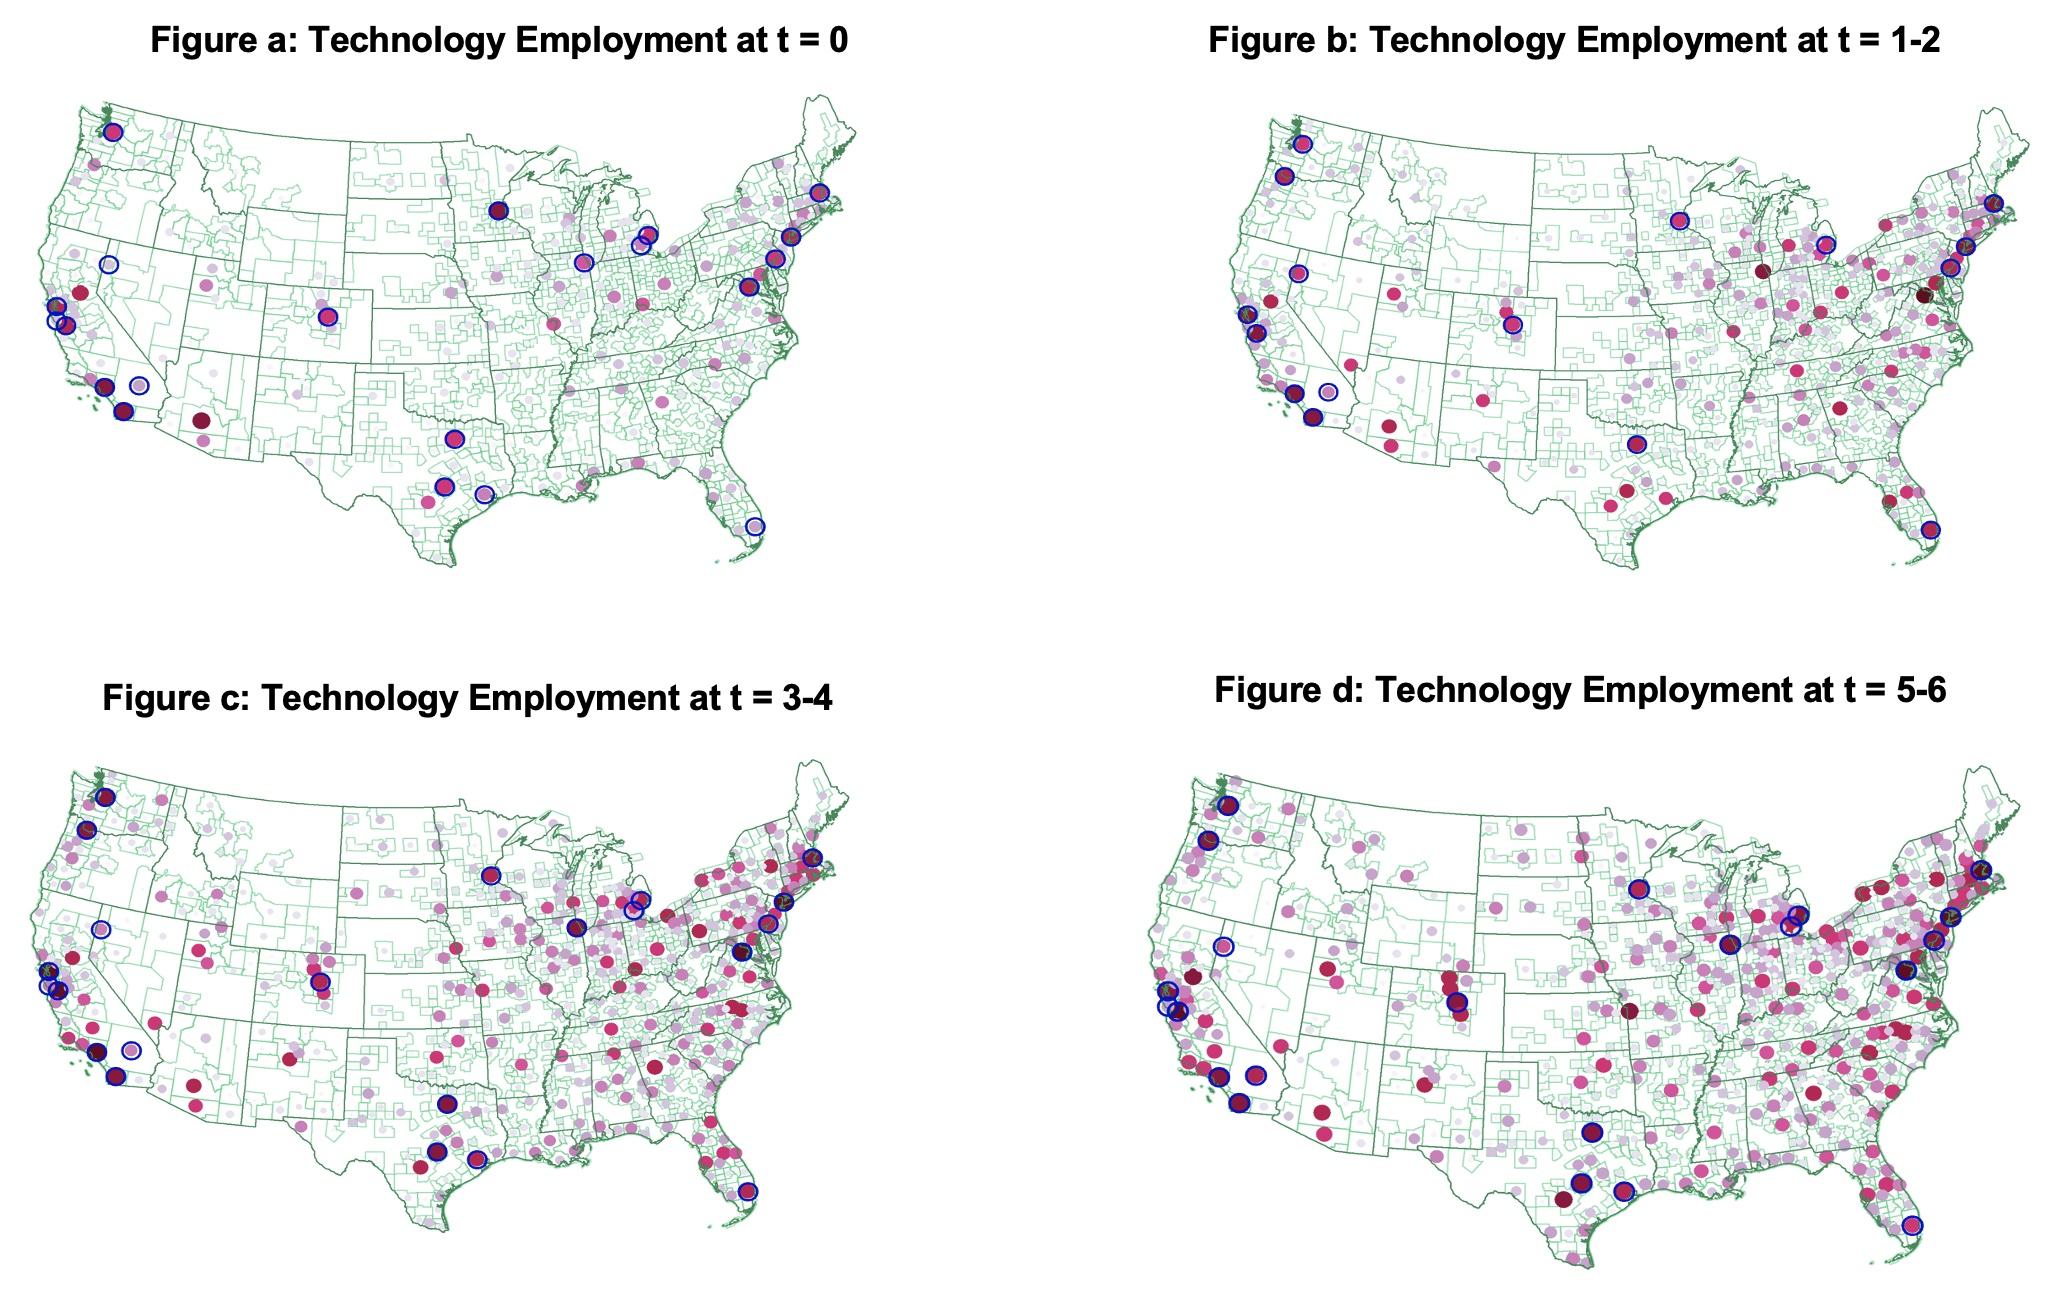
In Figure 2, we plot the geographic concentration (as measured by coefficient of variation across regions in the US) of job postings involved with using, producing, or developing one of our disruptive technologies against the number of years that have elapsed since the technology had its commercial breakthrough. Our findings suggest that despite the highly skewed initial distribution, as technologies mature and the number of new jobs related to them grows, they gradually spread geographically. We see this pattern of ‘region broadening’ in virtually every technology that we examine. In Figure 3, we see this geographical dispersion unfolding over time.
Figure 2 Geographic concentration of hiring for new technologies since emergence
Figure 3 Technology diffusion from pioneer locations
Notes: This figures shows: 1) In Figure (a) the Core based Statistical Areas (CBSAs) which are technology hubs for at least one technology, where the size of the circles is proportional to the share of technologies for which the CBSA is a hub; 2) In Figure (b) we show the share of technologies for which the Normalize sharei,,t of technology hiring at the CBSA in the year of emergence is greater than 1% (t=0). In Figure (c), (d) and (e), we repeat the mapping in (b) for years since emergence 1-2, 3-4, and 5-6, respectively. We plot these pictures only for 13 out of our 29 technologies which have year of emergence after 2007 for a complete panel of each technology.
Next, we study the skill requirements of jobs associated with disruptive technologies. We relate the share of technology job postings which require a college education to the number of years since its commercial breakthrough. We find a steep downward relationship, which suggests that while initial hiring is concentrated on high-skilled jobs, over time, the mean required skill level of the jobs associated with the technologies declines. Each additional year since the emergence of the technology is associated with a fall of about 0.96 percentage points in the share of job postings requiring a college education. We interpret this as ‘skill broadening’ of the types of jobs that adopt a given technology.
Importantly, it appears that region and skill broadening interact, so that low-skill jobs associated with a given technology spread out across space significantly faster than high-skill jobs. Our analysis suggests low-skilled jobs that use or produce new technologies are almost fully dispersed geographically within 20 years, whereas high-skilled jobs in that technology are much slower to disperse.
In particular, high-skilled jobs associated with disruptive technologies remain strongly focused on the original pioneer locations that were originally involved with developing the technology. Our estimates imply that it takes almost 40 years for high-skilled job postings to fully disperse from these pioneer locations. Perhaps not surprisingly, such pioneer locations tend to be located around universities and areas with more educated populations. Thus, regions with strong local education, research institutions, and universities are appearing to benefit from successful disruptive innovation for substantial periods of time. Of course, the reasons why original pioneer locations retain their initial advantages may be complex. (Two interesting explorations of these issues are Chaterji et al. 2013 and Dauth et al. 2019). One possibility is that the original pioneers become major employers; another is that established firms based elsewhere move jobs to the hubs. In follow-on work, we seek to better understand the roles of established firms and startups in sustaining the dynamics of prolific pioneer locations.
References
Andrews, M and A Whalley (2021), “The geography of innovation between 1866 and today.” VoxEU.org, 20 February.
Autor, D H, L F Katz, and M S Kearney (2008), "Trends in US wage inequality: Revising the revisionists", Review of Economics and Statistics 90: 300-323.
Bai, J, S Bernstein, A Dev, and J Lerner (2021), “The government as an (effective) venture capitalist,” VoxEU.org, 14 May.
Bloom, N, T A Hassan, A Kalyani, J Lerner, and A Tahoun (2021), “The Diffusion of Disruptive Technologies”, NBER Working paper no. 28999.
Chatterji, A, E Glaeser, and W Kerr (2013), “The origins of entrepreneurship and innovation clusters.” VoxEU.org 4 June.
Dauth, W, S Findeisen, E Moretti, and J Südekum (2019), “Assortative matching in cities”, VoxEU.org, 6 January.
Goldin, C D, and L F Katz (2009), The Race Between Education and Technology, Harvard University Press.
Katz, L F and K M Murphy (1992), "Changes in relative wages, 1963-1987: Supply and demand factors", Quarterly Journal of Economics 107: 35-78.
Lychagin, S, J Van Reenen, M Slade, and J Pinkse (2010), “You can raise productivity through R&D, but geography matters a lot”, VoxEU, 25 October.
Popp, D (2002), "Induced innovation and energy prices," American Economic Review 92: 160-180.
Song, J, D J Price, F Guvenen, N Bloom, and T Von Wachter (2019), "Firming up inequality", Quarterly Journal of Economics 134: 1-50.
Webb, M (2020), “The impact of artificial intelligence on the labor market”, Unpublished working paper, Stanford University.


