Former Federal Reserve Chairman Ben Bernanke famously quipped in 2014 that QE “works in practice, but it doesn’t work in theory”. Central banks around the world seem convinced; among others, the ECB, the Bank of England, and the Bank of Japan have recently expanded their large-scale asset purchasing programmes (LSAPs) to stimulate their economies. In the US, LSAPs increased the size of the Federal Reserve’s balance sheet by a factor of five between 2008-2014.1 Notably, LSAPs have varied significantly in the types of assets purchased by central banks, from Treasuries and mortgage-backed securities (MBS) in the US to exchange-traded funds (ETFs) and corporate bonds in Japan. Despite this surge in the popularity of LSAPs worldwide, their effectiveness and the channels through which they affect the real economy have been at the centre of a vigorous policy and academic debate. Does quantitative easing (QE) affect the real economy? How? What should guide central bankers as they implement LSAPs?
The intuition behind LSAPs is to flatten the yield curve and stimulate borrowing, investment, and spending by bidding up the price of long-term debt through massive central bank purchases.2 Recent work has suggested several channels through which LSAPs may affect the economy –Krishnamurthy and Vissing-Jørgensen (2011) describe these channels and provide empirical evidence from asset yields on the relative importance of each, concluding that Fed MBS purchases affect MBS yields more than do Fed Treasury purchases.3 Under the duration-segmentation or portfolio-rebalancing channels, purchasing any long-term assets will be effective stimulus because investors will reallocate their resources to other long-duration assets not purchased by the central bank. If, however, the financial intermediation sector is acutely constrained, there will be only limited spillovers of central-bank purchases to other asset classes and the effectiveness of LSAPs will depend on the specific assets purchased. Our recent study uses the mortgage market as a laboratory to uncover new empirical evidence for this limited-spillovers view of LSAPs (Di Maggio et al. 2016).
Exploiting mortgage-market segmentation to identify causal effects
Because macroeconomic policy is intended to affect the entire economy, it is notoriously difficult to find a suitable control group for comparison to ascertain its effectiveness. For traction, our empirical strategy exploits the segmentation of the US mortgage market and the Federal Reserve Act restriction that the Fed can only purchase government-guaranteed debt. In particular, the Fed is prohibited from purchasing so-called non-conforming loans, which exceed published conforming loan limits and/or have loan-to-value (LTV) ratios above 80%.4
To understand how QE purchases differentially affected various mortgage segments, we use a novel database that merges loan- and borrower-level panel data, allowing us to track borrowers across mortgages and to account for credit demand and supply shocks that might otherwise confound our results. In addition to interest rates, we focus on the volume of refinance mortgage origination in each segment, an approach that has several advantages over existing methodologies. Event studies that investigate secondary-market yields may overstate the real effects of LSAPs because of imperfect pass-through of MBS yields to primary-market mortgage interest rates (Fuster et al. 2013, Scharfstein and Sunderam 2013). Moreover, interest rates themselves are only observed conditional on loan origination, meaning that interest rate changes may also overestimate the effectiveness of a given QE campaign by assuming perfect availability of credit.
The direct lending channel of LSAPs
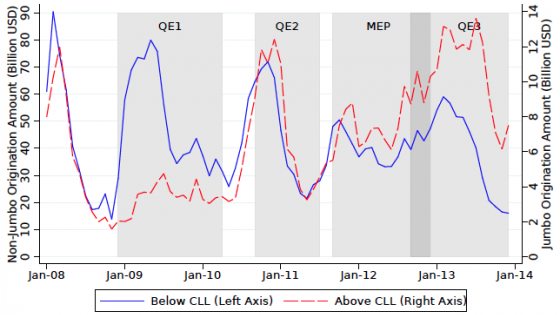
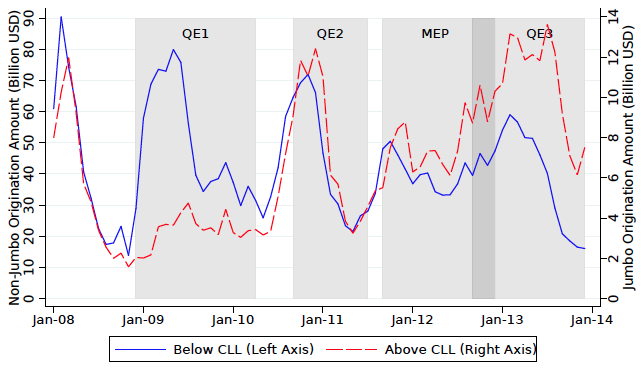
Figure 1 summarises our main finding, which is robust to several alterative regression specifications. During the first three months of QE1 purchases, we find that financial institutions more than tripled their monthly origination of GSE-eligible refinance mortgages (blue line), while the origination of so-called jumbo loans above the conforming loan limit (red line) increased much less dramatically over the same time frame.5 Was this heterogeneous response to QE1 a product of QE1’s significant MBS purchases? Yes – Figure 1 also shows that QE2 purchases, which consisted exclusively of Treasuries, had no differential effects on the jumbo and non-jumbo segments. Moreover, the disparity in QE1 effectiveness seems to rely on frictions in the lending industry. While QE3 also involved MBS purchases, QE1 occurred at a time when the banking sector was much less healthy and had much stronger differential effects than did QE3, visible in Figure 1.
Figure 1
Note: Figure plots the dollar volume of refinance mortgage origination above and below the conforming loan limit.
Source: Authors calculations scaled for data coverage using BlackKnight LPS Data.
These results suggest a direct lending channel of QE, whereby Fed MBS purchases constitute de facto direct lending to households in a way that would not have happened if the Fed had not purchased MBS during QE1. Conservatively using the jumbo segment to model the counterfactual of what would have happened to the conforming segment if QE1 purchases had not included Agency MBS, we estimate that QE1 MBS purchases (instead of an amount of Treasuries that would have equivalently moved the yield curve) increased refinance-mortgage origination by at least $600 billion, substantially reducing interest payments for refinancing households, and resulting in larger average annual savings than the one-time stimulus checks. We also find that many households with LTVs lower than 80% cashed-out on average an additional $12,000. Our back-of-the-envelope calculations suggest that these savings and the corresponding boom in equity extraction increased mortgagors' consumption by $76 billion. Surprisingly, we find that the QE1-induced reduction in interest rates can only explain about 25-45% of the observed increase in the refinancing volume, reinforcing the importance of using data on quantities (instead of just asset prices) to measure the effectiveness of monetary stimulus.
The intensive margin response of household mortgage debt
The granularity of our data also allows us to study how this QE1-driven differential expansion in credit for the GSE segment of the mortgage market affected household borrowing and saving decisions. Figure 2 plots the LTV distribution for borrowers with an initial LTV between 80% and 90% that refinanced during the beginning of QE1, along with the LTV distribution of these refinancing borrowers’ subsequent mortgages.6 We observe significant bunching at the 80% LTV cutoff for Fed-purchase eligibility, highlighting the tightness of credit for mortgage market segments not directly stimulated by Fed MBS purchases. Around 34% of households who refinanced a mortgage with a current LTV of 80-90% (thus initially ineligible for purchase by the Fed) delever into an 80% LTV mortgage, increasing their equity position and decreasing their liquid wealth by an average of $9,000.
Figure 2
Note: Figure plots the LTV distribution of loans with an 80-90% LTV that refinanced during the first six months of QE1 along with the LTV distribution of the subsequent refinance mortgages.
Source: Authors calculations using BlackKnight LPS Data.
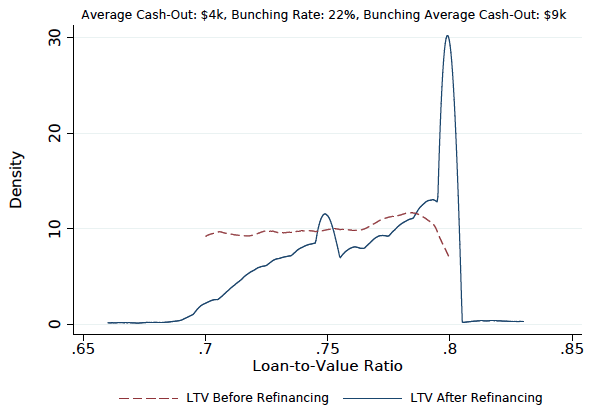
GSE LTV policy was also important for conforming borrowers that levered against their home equity by cash-out refinancing. Figure 3 shows that about 22% of borrowers with an initial LTV between 70-80% levered to an 80% LTV refinance mortgage, cashing out an average of $4,000 and significantly affecting refinancing borrowers’ consumption. This household balance sheet response to interest rate changes and its dependence on current home equity highlights how accommodative monetary policy may not benefit distressed regions, where borrowers have less equity to extract, nearly as much as comparatively non-distressed areas, where outstanding LTVs are lower on average (see Beraja et al. 2016 for further discussion of the regional heterogeneity in QE effectiveness).
Figure 3
Note: Figure plots the LTV distribution of loans starting with a 70-80% LTV that refinanced during the first six months of QE1 along with the LTV distribution of the subsequent refinance mortgages.
Source: Authors calculations using BlackKnight LPS Data.
Using our statistical model of the relationship between QE1 purchases, debt origination, and equity extraction, we evaluate the effectiveness of an oft-proposed macroprudential tool: countercyclical leverage caps. Specifically, we investigate what would have been the effect of an increase in the GSE LTV cap from 80% to 90%. While low-downpayment loans are frequently maligned as a contributor to the housing crisis, leverage ratios would ideally be tight during credit expansions and loose during contractions to smooth macroeconomic shocks.
We estimate that this simple policy would have increased the number of refinancing households by over 410,000 during the first six months of QE1, a $92 billion increase in refinance mortgage origination. Notably, this policy would have also generated an almost 20% increase in equity cashed-out ($10 billion) with potentially important effects on aggregate demand. Ultimately, such a policy would have been more effective in terms of refinances and aggregate volume than the Home Affordable Refinancing Program, partly because raising LTV caps would have increased cash-out refinances (and thus aggregate consumption) in a way that HARP eligibility restrictions did not allow.7 This highlights that LSAP policies ought not to be designed in a vacuum – there is an important complementarity between mortgage market policy and the effectiveness of Fed MBS purchases.
Conclusion
When LSAPs are needed the most, simply bending the yield curve through purchasing government debt is not effective for stimulating the mortgage market (a key sector of the economy for the transmission of monetary policy). Purchasing mortgage-backed securities when banks are reluctant to lend can very effectively open a direct-lending channel from central-bank purchases to households. Given the limited spillover of Fed purchases during times of stress, Federal Reserve Act provisions that restrict Fed purchases to government-guaranteed debt have important consequences in allocating credit to certain sectors (i.e. housing) and particular segments within those sectors (i.e. conforming mortgages). There is a strong interaction between GSE policy and the effectiveness of MBS purchases, with the latter depending crucially on the former. Our counterfactual estimates suggest that countercyclical maximum LTV requirements would have made Fed QE purchases significantly more effective.
References
Beraja, M., A. Fuster, E. Hurst, and J. Vavra (2015), “Regional heterogeneity and monetary policy”, Staff Report, Federal Reserve Bank of New York.
Bernanke, B. (2012) “Monetary Policy since the Onset of the Crisis.” Remarks at the Federal Reserve Bank of Kansas City Economic Symposium, Jackson Hole, Wyoming, 31 August.
Bernanke, B. (2014) “A Conversation: The Fed Yesterday, Today and Tomorrow”, Interview with Liaquat Ahamed, Brookings Institution, 16 January 2014.
Bernanke, B. (2015) The Courage to Act: A Memoir of the Crisis and Its Aftermath, W. W. Norton.
Curdia, V. and M. Woodford (2011) “The Central Bank’s Balance Sheet as an Instrument of Monetary Policy”, Journal of Monetary Economics 58(1), 54–79.
Di Maggio, M., A. Kermani, and C. Palmer (2016) “How Quantitative Easing Works: Evidence on the Refinancing Channel”, NBER Working Paper No. 22638.
Fuster, A., L. Goodman, D. O. Lucca, L. Madar, L. Molloy, and P. Willen (2013) “The rising gap between primary and secondary mortgage rates”, Economic Policy Review 19 (2).
Gertler, M. and P. Karadi (2011) “A model of unconventional monetary policy”, Journal of Monetary Economics 58 (1), 17–34.
Greenwood, R., S. G. Hanson, and G. Y. Liao (2015) “Price Dynamics in Partially Segmented Markets”, HBS Working Paper.
He, Z., and A. Krishnamurthy (2013) “Intermediary asset pricing”, The American Economic Review, 103(2), 732-770.
Krishnamurthy, A. and A. Vissing-Jorgensen (2011) “The Effects of Quantitative Easing on Interest Rates: Channels and Implications for Policy”, Brookings Papers on Economic Activity, 215.
Scharfstein, D. S. and A. Sunderam (2013) “Concentration in Mortgage Lending, Refinancing Activity and Mortgage Rates”, NBER Working Paper No. 19156.
Vayanos, D. and J.-L. Vila (2009) “A Preferred-Habitat Model of the Term Structure of Interest Rates”, NBER Working Paper No. 15487.
Endnotes
[1] LSAPs are commonly referred to as quantitative easing. Bernanke lobbied unsuccessfully for the press to adopt the term ‘credit easing’ instead of quantitative easing (Bernanke, 2014).
[2] Then-Chairman Bernanke explained the rationale in a 2012 speech: “As investors rebalance their portfolios… the prices of the assets they buy should rise and their yields decline as well. Declining yields and rising asset prices ease overall financial conditions and stimulate economic activity through channels similar to those for conventional monetary policy.”
[3] Under the portfolio-rebalancing channel, the central bank affects the return of different assets by affecting their relative supply. The segmentation channel posits that QE is effective when intermediaries are unable to arbitrage across different market segments in the short run (Vayanos and Vila 2009, Greenwood et al. 2015). The capital-constraints channel emphasizes that LSAPs can offset the decline in private lending from disruptions in financial intermediation (Gertler and Karadi 2011, Curdia and Woodford 2011, He and Krishnamurthy 2013).
[4] We focus on government-sponsored enterprise (GSE) mortgages instead of low-downpayment FHA mortgages (also eligible for Fed purchase) for our analysis to be able to compare market segments with similar lending standards. An important exception to the 80% LTV cutoff for GSE mortgages was made possible by the Home Affordable Refinancing Program (HARP), a policy we show had visible effects on the effectiveness of Fed MBS purchases. Additionally, mortgages with private mortgage insurance (PMI) are exempt from the 80% LTV requirement, although the PMI industry was virtually nonexistent in 2009.
[5] Lending standards in the prime conforming and prime jumbo mortgage market segments are broadly comparable. Our regression framework allows us to account for several forms of observed and unobserved borrower heterogeneity.
[6] While the LTV distribution of all outstanding mortgages (not shown) is uniform, refinanced mortgages’ current LTVs were much more likely to be close to 80%, additional evidence of the frictions associated with non-GSE–eligible refinancing during this time period.
[7] That said, we do find evidence that HARP significantly alleviated deleveraging behavior by allowing eligible high-LTV borrowers refinancing opportunities.


