Consumers tend to be loyal to products they purchased in the past, which can confer market power to companies that are able to extract higher prices from their captive customers (Dubé et al. 2010). To understand how customer habits evolve and how they shape firm pricing and consumer welfare, it is important to understand how easily habits can be disrupted and behaviour altered. Recently, shops have experienced ‘stockouts’ due to COVID-related purchases in categories such as prepared food and toilet tissue. Supply chain disruptions have also led to shortages of certain goods, forcing consumers to switch to different brands than those they typically purchase.
There are two factors that can lead to customers repeatedly purchasing the same product: preferences and state dependence (Heckman 1981). The explanation for the former is intuitive: customers have different preferences and consistently purchase the products that they like. Alternatively, product loyalty may be driven by state dependence. This explanation suggests that customers’ purchase histories affect their subsequent choices, i.e. a customer is more likely to purchase a product because they purchased it in the past. While both factors likely affect product loyalty to some extent, understanding their relative magnitudes is important for firm pricing and consumer welfare. If the effect of state dependence is very strong, that suggests that firms could capture customers with temporary price discounts and rely on their loyalty even after raising prices. Alternatively, if unobserved preferences predominantly explain brand loyalty, a temporary price discount would have smaller long-term effects, as customers would continue to buy their preferred product after prices were restored.
A natural experiment
In a recent paper (Levine and Seiler 2021), we develop a test for the presence of state dependence with a novel natural experiment. The ideal experiment would randomly assign a group of customers to switch from their usual brand (brand A) to a different brand of equal quality (brand B). We would then observe their subsequent choices. A complete reversion to brand A would suggest that there is no effect of state dependence, and that persistent choices of brand A exist because people prefer that brand. A complete conversion to brand B would suggest that there is no effect of unobserved preferences, and that brand loyalty exists merely out of state dependence.
In lieu of such an experiment, we use naturally occurring stockouts that force some households to switch from their usual brand, allowing us to study dynamics following this random variation in choice sets. We identify areas and times where stockouts are likely to happen due to hurricane preparations using a publicly available hurricane tracking database maintained by the US National Hurricane Center. We use the Nielsen Retail Scanner dataset to select counties that were sufficiently close to the hurricane that also experienced demand spikes in hurricane staples (canned soup, batteries, bottled water) immediately preceding the hurricane. Using the Nielsen HomeScan panel, which documents customers’ purchases over time, we identify the set of households that live in these counties as having been likely to encounter a stockout. We compare purchase patterns among these households (the treated group) against a control group consisting of households that live far from the path of the hurricane, and thus did not have a random shock to their choice sets.
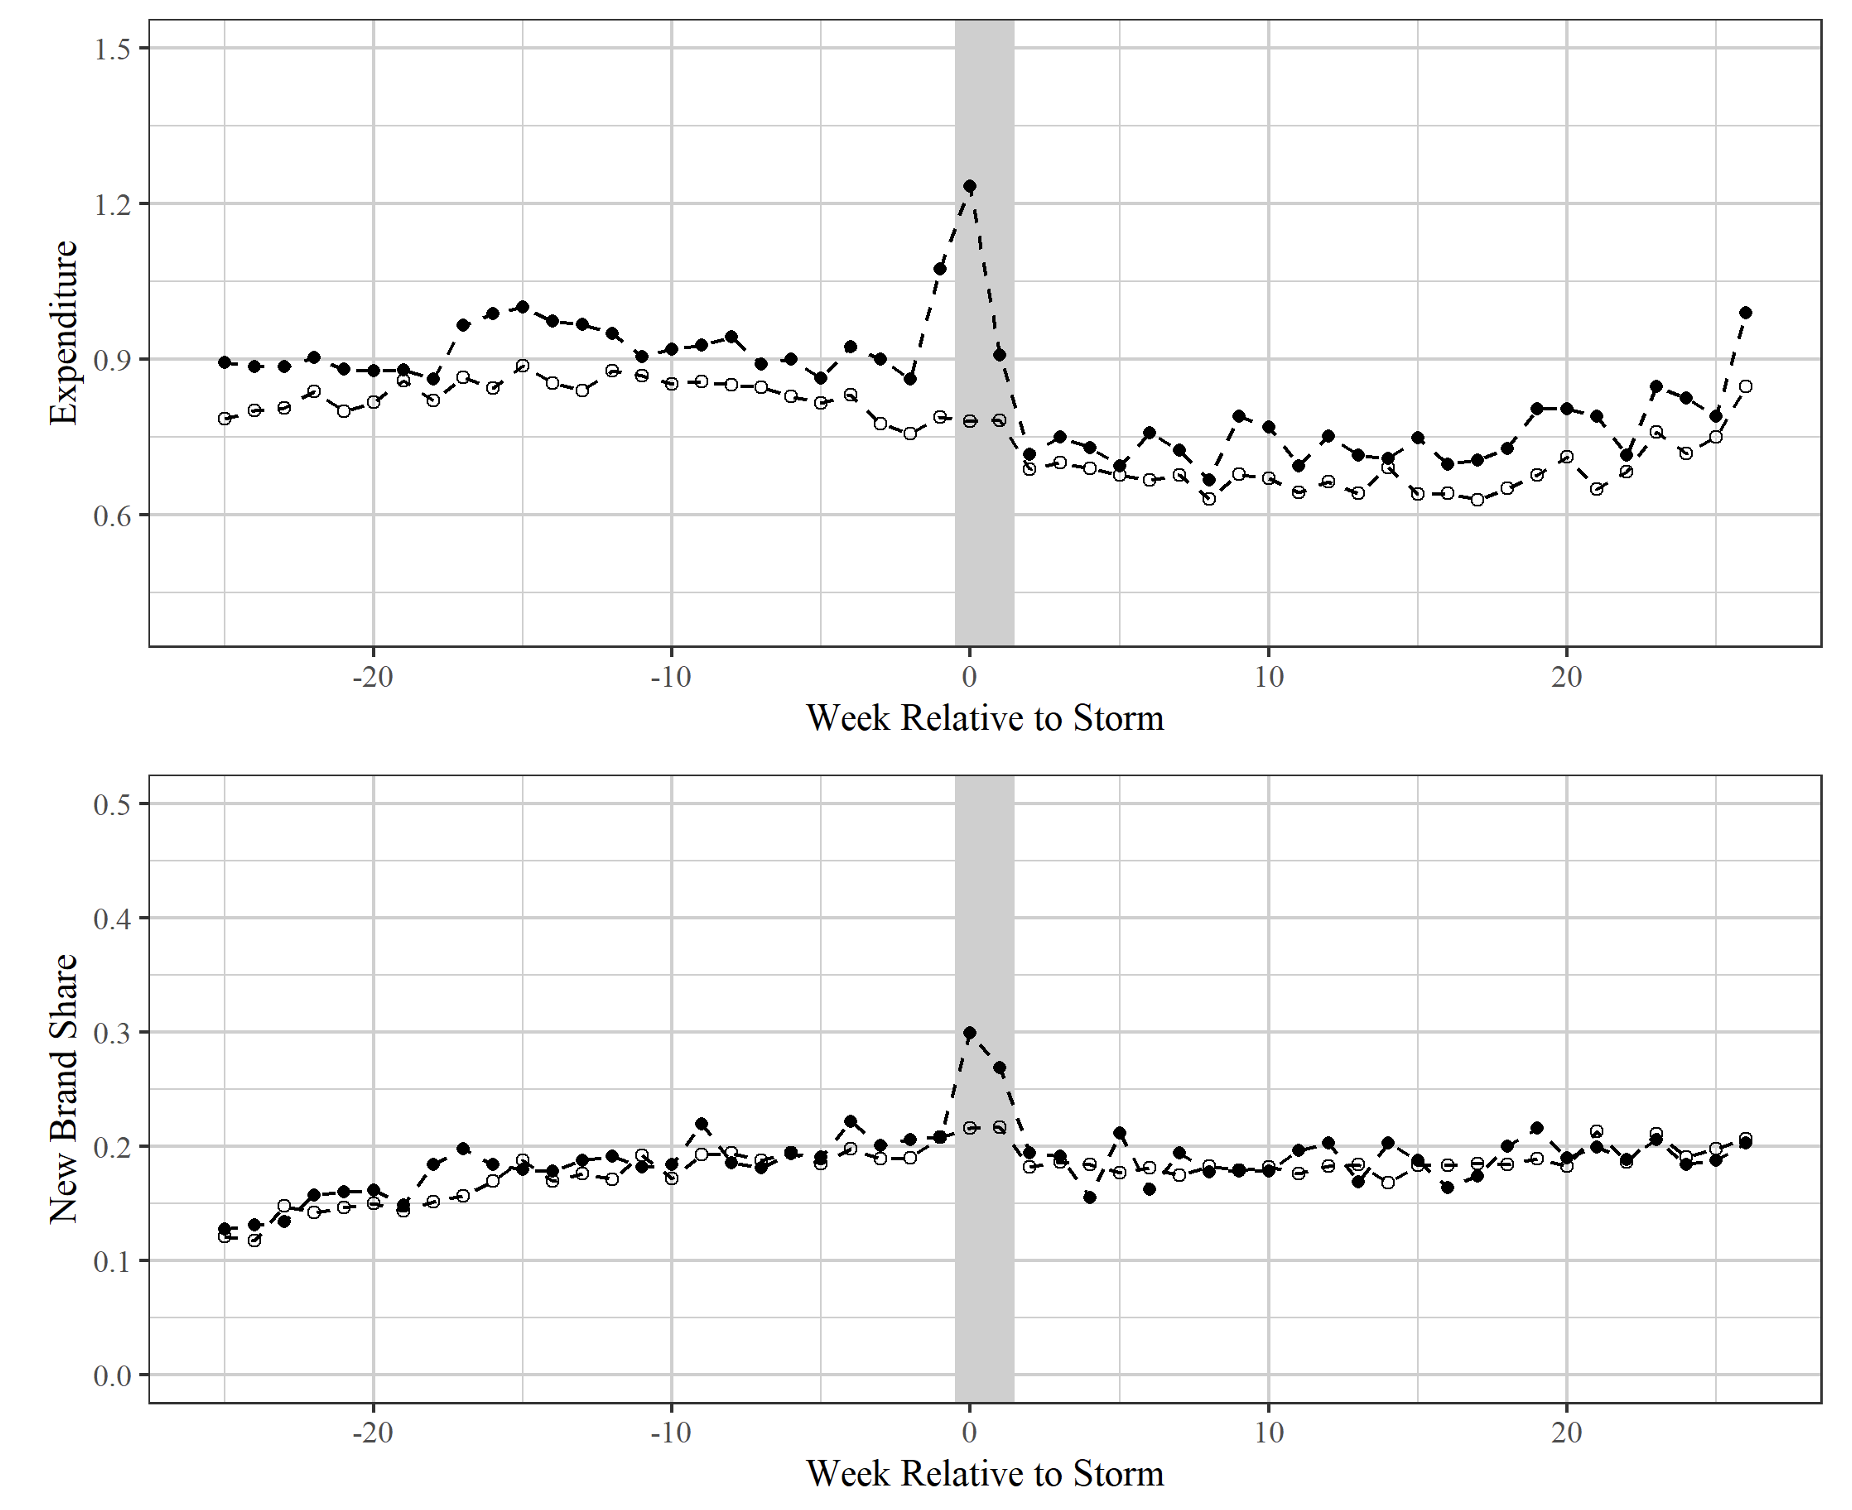
We focus our analysis on bottled water, something that many people stockpile in preparation for a hurricane. The top panel of Figure 1 shows average weekly expenditure by week relative to the hurricane separately for the treated and control groups. The grey region covers weeks 0 and 1, with week 0 representing the week leading up to the hurricane. We observe an increase in expenditure on bottled water for treated households in the weeks surrounding the hurricane, validating our selection criteria: treated households did increase demand for a hurricane staple in the weeks preceding the hurricane.1
This increase in demand increases the probability of stockouts of individual brands, which is the variation we exploit for our analysis. The bottom panel of Figure 1 shows evidence of this, plotting the share of ‘new’ brands over time, averaged across households within the treated and control group. This measure divides the number of purchased brands that were new to a household by the number of unique purchased brands.2 The increase in new brand share for the treated group during weeks 0 and 1 suggests that the increase in demand resulted in a higher likelihood of a brand being out of stock, causing some households to switch to a new brand.
Figure 1 Bottled water expenditure and purchases of new brands
Methodology and variable construction
By construction, the treated and control households live in different geographic regions; treated households live close to a hurricane and control households do not. Likely as a result, we find that there are time-varying differences in purchase behaviours between groups. We therefore construct a synthetic control group, following Xu (2017). This method uses control group data to estimate time-varying factors that are common across households. It then uses pre-hurricane data to estimate how these factors should be weighted for each treated household, to minimise prediction error. Lastly, we construct a synthetic control household for each treated household, allowing us to compare treated households’ loyalty to what their loyalty would have been without the hurricane.
Our analysis focuses on a variable that describes brand (and UPC) loyalty. This variable is the share of unique brands (or UPCs) purchased within the bottled water category that were purchased during the last purchase occasion. A value of 1 (0.5) means that all (half) of the brands purchased were purchased during the customer’s last purchase occasion. During the first trip after the storm, the variable would measure loyalty to the brand that customers purchased during the hurricane. Even in the presence of state dependence, this value would be lower for treated customers than for control customers because some of them are bound to revert to their preferred brand. Therefore, we make one modification to this variable to ease interpretation: during the first trip after the hurricane, this variable represents the share of unique brands (or UPCs) purchased that were purchased during the customer’s last pre-hurricane purchase occasion. If this modified measure, hereafter referred to as ‘loyalty’, is not significantly different between the treated and control households following the stockout, that means that treated households are as loyal to their pre-hurricane choices as control households are, despite the shock to their hurricane choice. This would suggest that there is no substantial effect of state dependence. However, if this variable is lower for treated households than for control households, that would suggest that some households shifted loyalty to their hurricane choices.
Results
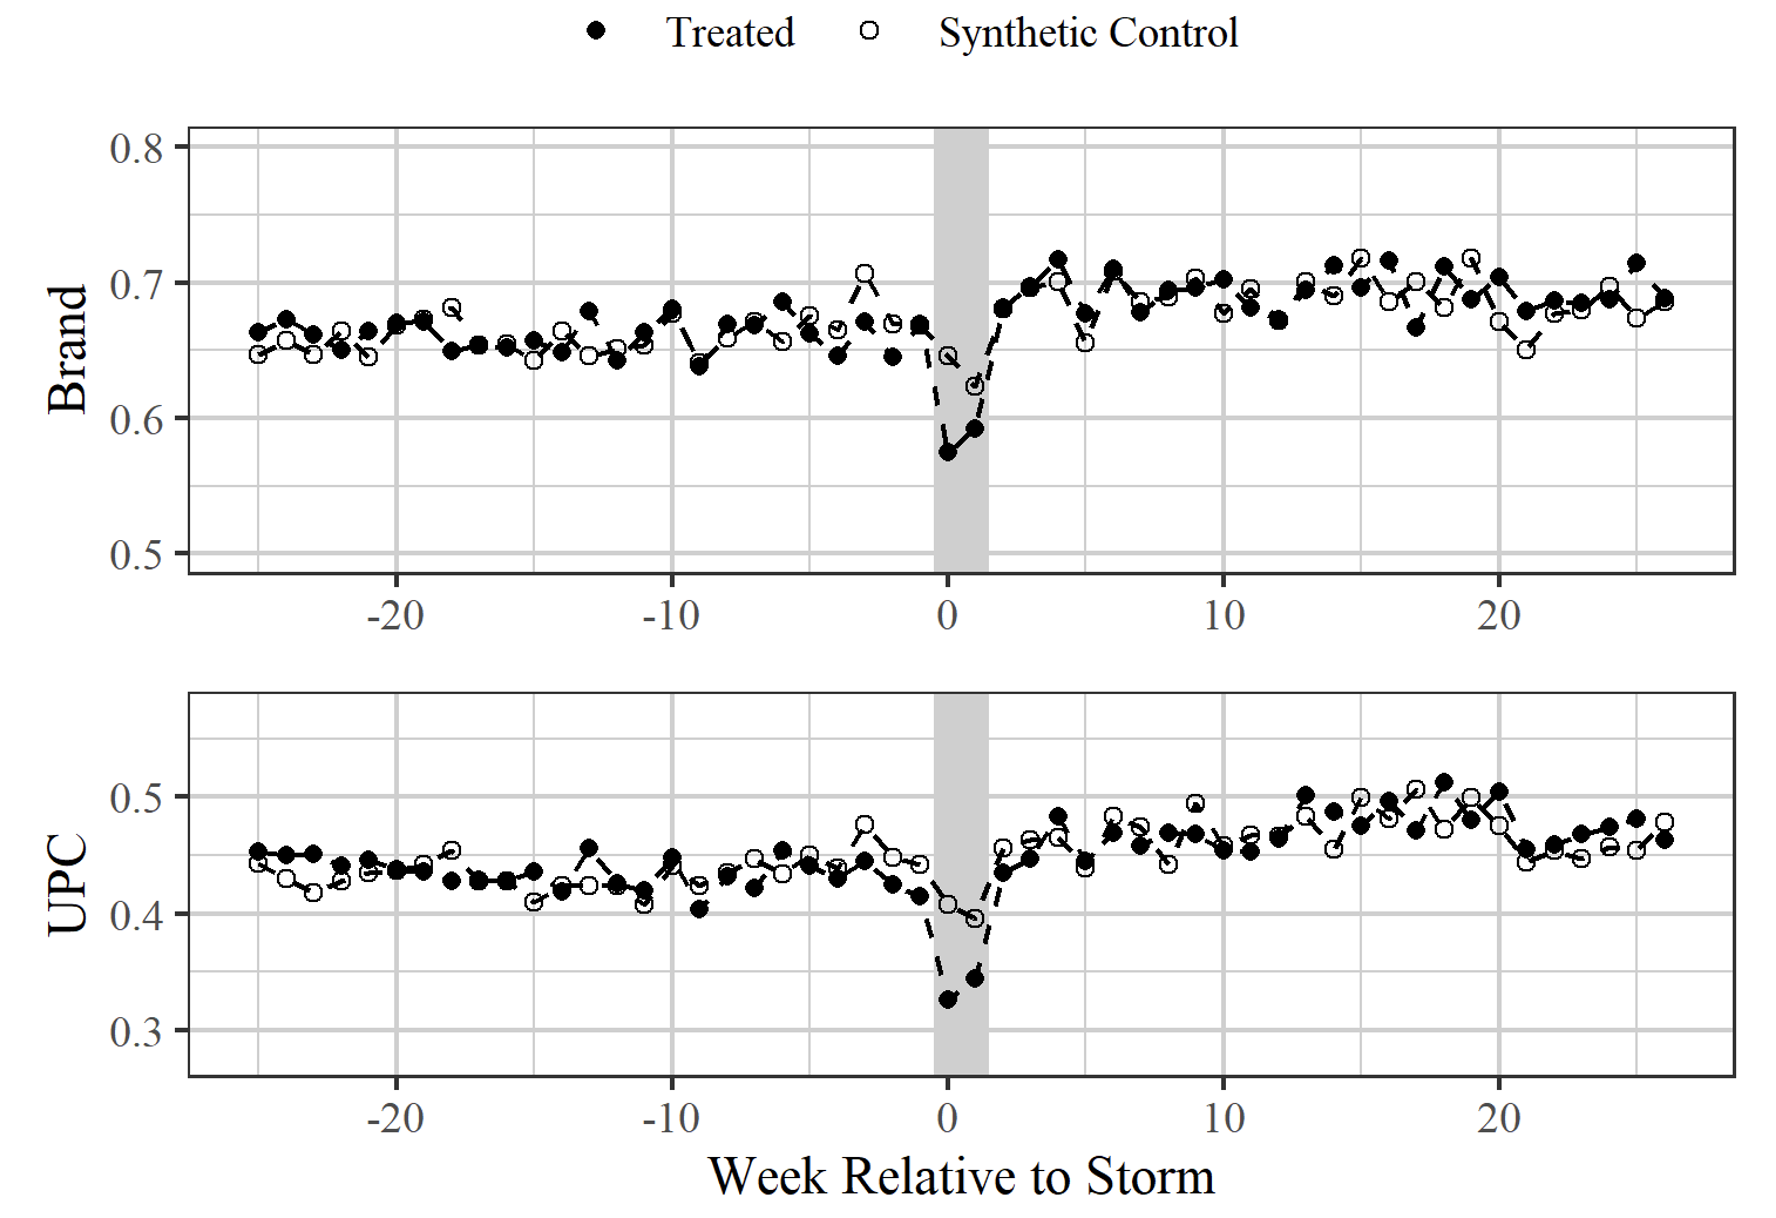
Figure 2 shows loyalty over time, averaged across households within the treated and synthetic control group. We see a significant decrease in brand (and UPC) loyalty for treated households during the stock-out (weeks 0 and 1.) This mirrors the increase in new brand share presented in the bottom panel of Figure 1. Importantly, there is no visual difference between treated and control households in loyalty following the stockouts. Rather, treated households seem to immediately revert to their pre-hurricane choices.
Figure 2 Average loyalty for treated and synthetic control households
We test this more formally by estimating average treatment effects (ATEs) over time. The ATE is the average difference between treated and synthetic control households at a given time. The synthetic control method allows us to generate standard errors, using bootstrap draws. We find that although there is a large and significant decrease in loyalty during the stockout weeks, there is no effect in the post-hurricane period.
Contrary to prior research (Dubé et al. 2010, Simonov et al. 2020), we do not find evidence of state dependence in bottled water brand or UPC choices. One possible explanation for this is that our natural experiment forces consumers to choose the last remaining options during a stockout, which may be lower quality or more expensive than their usual choices. However, we find that there are no changes in product popularity or prices during the hurricane. Regardless, we estimate treatment effects for several subsets of the treated households: those that purchased more/less popular products and those that purchased more/less expensive products. We find that there is no long-term effect of the stockout for any of these sub-groups, suggesting that the null effect is not driven by unusual switching behaviour.
Another explanation for our contrary findings is that we are studying the bottled water category, where customers may have less defined preferences. However, we find that bottled water purchases exhibit similar levels of loyalty as other CPG categories commonly studied, such as margarine and orange juice.
Authors’ note: Researchers' own analyses calculated (or derived) based in part on data from Nielsen Consumer LLC and marketing databases provided through the NielsenIQ Datasets at the Kilts Center for Marketing Data Center at The University of Chicago Booth School of Business. The conclusions drawn from the NielsenIQ data are those of the researchers and do not reflect the views of NielsenIQ. NielsenIQ is not responsible for, had no role in, and was not involved in analysing and preparing the results reported herein.
References
Dubé, J-P, G J Hitsch and P E Rossi (2010), “State Dependence and Alternative Explanations for Consumer Inertia”, The RAND Journal of Economics 41(3): 417–445.
Heckman, J J (1981), “Heterogeneity and State Dependence,” in S Rose (ed.), Studies in Labor Markets, University of Chicago Press.
Levine, J and S Seiler (2021), “Identifying State Dependence in Brand Choice: Evidence from Hurricanes,” SSRN Electronic Journal.
Simonov, A, J-P Dubé, G Hitsch, and P Rossi (2020), “State-Dependent Demand Estimation with Initial Conditions Correction,” Journal of Marketing Research 57(5): 789–809.
Xu, Y (2017), “Generalized synthetic control method: Causal inference with interactive fixed effects models,” Political Analysis 25(1): 57–76.
Endnotes
1 There is seasonality in expenditure on bottled water, likely following seasonal demand. Week 0 usually falls some time between June and November, so the decrease in expenditure following week 0 coincides with colder temperatures.
2 Brands are defined as ‘new’ if they were not purchased by the household during a six-month period preceding the main sample.
