Following the 2008–2013 financial and debt crisis, the ECB introduced new monetary policy instruments, including large-scale securities purchase programmes, to support price stability and economic growth. These tools have also been in active use during the COVID crisis. These policies have raised concerns in the public debate that central banks’ securities purchase programmes could have disproportionately benefited wealthy households due to increased asset prices. However, a monetary expansion that stimulates aggregate demand also benefits low-income households through an improvement in their employment prospects and wage growth. Given this ambiguity over the net equality effects of monetary policy, the topic has become a lively area of research and policy debate (e.g. Coibion et al. 2015, Ilzetzki 2021). In a recent study (Mäki-Fränti et al. 2022), we pursue this question using Finnish data. The advantage of looking at a small open economy member state is that it is arguably free from the perennial endogeneity problems when identifying the causal effects of monetary policy and, naturally, the effects of monetary policies are unconfounded by exchange rate considerations.
Main channels
Monetary stimulus supports economic growth, which then boosts employment and supports wage growth. At the household level, the effects of monetary policy depend on how strongly the policies are reflected in household income and employment in different income brackets. Low-income households in particular benefit from the creation of new jobs, as unemployment is typically more prevalent than average among such households. In this respect, accommodative monetary policy may reduce income inequality.
An increase in wages, on the other hand, mainly benefits those already employed, and the employment situation is typically better among highly educated, upper-income households. In this way, accommodative monetary policy may increase income inequality.
In addition to labour income, monetary policy also has an impact on households’ financial income. On one hand, low deposit rates reduce interest income. At the same time, faster economic growth supports the growth of dividends and rental income. Equity and fund shares owned by households are mostly held by wealthy households. For example, according to the Household Finance and Consumption Survey (HFCS) conducted by Statistics Finland, the wealthiest decile of households owned about 80% of listed shares and 60% of investment fund shares in Finland in 2016. The financial assets of households in lower wealth quintiles, if any, consist mainly of deposits (Figure 1). The numbers are qualitatively similar in other developed economies. In this respect, expansionary monetary policy may increase income inequality.
On the other hand, the share of financial income in total income may be small even among high-income households, except for the very wealthiest, as in the Finnish case. For this reason, an increase in financial income may not significantly affect the distribution of income across households as a whole.
When it comes to household wealth, monetary policy affects it through asset price movements. Low interest rates on mortgages increase the demand for housing, which in turn leads to higher house prices.
Figure 1 Residential property comprises most of households’ wealth in Finland
Source: Statistics Finland, Household Finance and Consumption Survey (2016) and authors’ calculations.
In the case of Finland, benefits from the increase in house prices are potentially widespread, as about 70% of Finnish households owned real estate property in 2016. According to the HFCS, real estate property comprises a large share of total assets in all net wealth quintiles, and it constituted 66% of the total value of the assets of Finnish households in 2016 (Figure 1). However, benefits from house price increases may be unevenly distributed due to regional divergence in the development of house prices. House prices may react to shocks most strongly in metropolitan areas where housing supply is relatively scarce and slow to respond to growth in demand (e.g. Glaeser et al. 2012).
Expansionary monetary policy also increases the value of shares and other financial assets by increasing demand for various securities and lowering discount rates on the financial markets. Households with significant financial wealth, typically the wealthiest households, benefit most from this. For example, while almost all households in Finland in 2016 held deposits, only 41% of households held listed shares or shares in investment funds.
Impact on Finnish economic growth
We look at the effects of both the ECB's interest rate policy and its securities purchase programmes on the Finnish economy and Finnish households. The research design seeks to isolate the causal effect of an unexpected monetary policy shock on the aggregate economy. A monetary policy shock is defined as an unexpected change in the key policy rate, whereas a QE shock is an unexpected and unsterilized change in a securities purchase programme. For comparability, we standardize both shocks in that the monetary policy shock reduces the short-term rate by 25 basis points, while the QE shock reduces the long-term rate by 25 basis points.
We start by examining the macroeconomic effects of the ECB's accommodative monetary policy on Finland in terms of economic growth, inflation, unemployment, and developments in nominal wages as well as stock and house prices. We then distribute these aggregate impacts across individual households using household-level data that contains detailed information on household income and wealth and the labour market status of its members. Finally, we assess the effects of monetary policy shocks on income and wealth inequality.
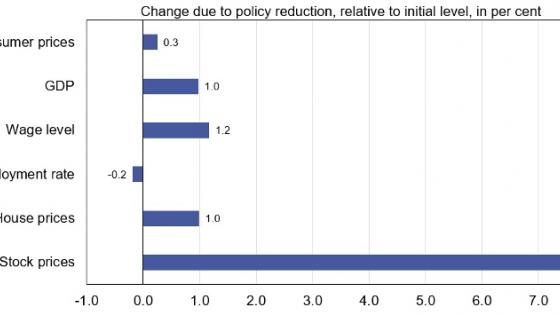
Figure 2 A reduction of the ECB policy rate by 25 basis points stimulates the economy in Finland
Source: Mäki-Fränti et al. (2022) and authors’ calculations.
Note: The figure depicts the average impact on Finnish macroeconomic variables of a 25 basis point ECB policy rate reduction. The presented impact is two years after the interest rate reduction. The change in unemployment rate is presented as a percentage point change from its initial level.
According to our results, there are no major differences between the reduction in the ECB’s key policy rate and the securities purchase programmes in terms of their macroeconomic impact. Reducing the key policy rate by 25 basis points increases GDP in Finland by about 1% within a two-year horizon. Unemployment declines and nominal wages rise, although the former responds rather weakly. Monetary stimulus also raises both housing and stock prices. The effects are clearly larger on the stock market than the housing market (Figure 2).
The effects of the ECB's monetary policy on economic growth and inflation in Finland are quite similar to those found for the large euro area member states as reported by, for example, Lenza and Slacalek (2021). However, the effects of economic growth on the labour market are reflected in Finland somewhat differently. In Finland, the employment effects of monetary policy remain modest compared with the large euro area countries, while the effects on household earnings are greater.
Small impact on income and wealth inequality in Finland
All households benefit from the monetary stimulus, as lowering the key policy rate by 25 basis points reduces unemployment and increases gross income within every income group. Unemployment declines most in the bottom income quintile. However, gross income grows most in the upper income quintiles, due to the increase in the nominal wage level (Figure 3). The central bank's securities purchase programmes have similar effects.
The value of households' net wealth (the value of assets less the value of liabilities) also increases in all net wealth quintiles, except for the bottom quintile where the initial net wealth is on average zero (Figure 3). The value of gross wealth increases most among the wealthiest households.
In terms of net wealth, leverage plays a significant role in the distribution of the effects of monetary policy across households. As a result of a policy rate decrease, net wealth increases the most in the second-poorest quintile of households. These households often have significant housing wealth but also large mortgages (Figure 3). Even a small increase in house prices and asset values will significantly improve the net asset position of these indebted households, as the nominal value of their debt remains constant. To the extent that large outstanding mortgage debt is typical for younger households, this result concurs with Bielecki et al. (2022). The central bank's purchase programmes have a similar effect on net wealth in different wealth brackets to a reduction in the key interest rate.
Overall, the impact of monetary policy on income and wealth inequality is nevertheless limited. The value of the Gini coefficient on gross income increases by 0.05 of a percentage point and that on net wealth by 0.2 of a percentage point within two years after the reduction in the key policy rate. The effects of securities purchase programmes on the Gini coefficients are of a similar magnitude. The impacts are also small relative to the overall historical developments in the Gini coefficients in Finland over the past few decades. Finally, we also look at the relative development of income and wealth among the best-off households by comparing the top income and wealth deciles with the respective medians. These measures of inequality convey a similar message.
Figure 3 A policy rate reduction lowers the unemployment rate and increases gross income in all income quintiles
Source: Mäki-Fränti et al. (2022) and authors’ calculations.
Note: The figure depicts the average impact of a 25 basis point ECB policy rate reduction on gross income and net wealth quintiles. The change in unemployment rate is presented as difference in percentage points. The diamonds represent point estimates of the impact and the vertical lines represent 68% intervals of the identified set. The presented impact is two years after the interest rate reduction.
Conclusions
In the case of the euro area, the overall message from the literature is that while the impact of the ECB's accommodative monetary policy on economic growth has been significant, the changes in income and wealth disparities have been on average small (Ampudia et al. 2018, Lenza and Slacalek 2021, Samarina and Nguyen 2022). According to our study, these conclusions broadly apply to Finland as well. Nevertheless, our results suggest that the precise channels through which monetary policy affects inequality may differ across countries. In particular, they may depend on the structure and elasticity of the labour market as well as the initial composition and ownership structure of assets in the economy.
References
Ampudia, M, D Georgarakos, J Slacalek, O Tristani, P Vermeulen, and G L Violante (2018), “Monetary policy and household inequality”, ECB Working Paper Series 2170.
Bielecki, M, M Brzoza-Brzezina, and M Kolasa (2022), “Intergenerational redistributive effects of monetary policy”, Journal of the European Economic Association, forthcoming.
Coibion, O, Y Gorodnichenko, L Kueng, and J Silvia (2017), “Innocent bystanders? Monetary policy and inequality,” Journal of Monetary Economics 88(C).
Glaeser, E, J Gottlieb, and K Tobio (2012), “Housing booms and city centers,” American Economic Review 102(3).
Ilzetzki, E (2021), “Monetary policy and inequality”, VoxEU.org, 18 August.
Lenza, M and J Slacalek (2021), “How does monetary policy affect income and wealth inequality? Evidence from quantitative easing in the euro area”, ECB Working Paper 2190.
Mäki-Fränti, P, A Silvo, A Gulan, and J Kilponen (2022), “Monetary policy and inequality: The Finnish case”, Bank of Finland Research Discussion Papers 3/2022.
Samarina, A and A Nguyen (2022), “Does monetary policy affect inequality in the euro area?”, Journal of Money, Credit and Banking, forthcoming.
Statistics Finland (2016), “Household Finance and Consumption Survey”.


