Tax and transfer systems play a crucial role in income redistribution and inequality reduction, but concerns have arisen about their effectiveness under the pressure of globalisation and the emergence of new forms of work. This has prompted vivid debates on introducing a universal basic income and reigniting tax progressivity through the taxation of top incomes and wealth (IMF 2017, OECD 2017, WID 2017).
In order to deliver evidence-based policy recommendations in this area, we first need to document and take stock of the extent to which tax and transfer systems mitigate market income inequality today, and how this has changed over a period of rising globalisation, technological change, and pressure from population ageing. This is what we set out to do in a recent paper, by conducting a comprehensive assessment of income redistribution covering OECD countries over the last two decades (Causa and Hermansen 2017).1 Redistribution is quantified as the relative reduction in market income inequality achieved by personal income taxes, employees’ social security contributions, and cash transfers, based on household-level micro data.
New findings
Taxes and transfers reduce market income inequality by slightly more than 25% on average across the OECD (Figure 1); but this average masks a great deal of heterogeneity ranging from 40% in Ireland to around 5% in Chile. The level of redistribution is also highly variable in countries exhibiting similar levels of market income inequality – for example, market income inequality stands at around 38 Gini points in both Japan and Norway, but disposable income inequality stands at around 27 points in Norway compared to 32 points in Japan. Such variations reflect cross-country differences in the size of the public sector, and, indeed, the level of redistribution is strongly associated with the level of public social spending on cash support to the working-age population, as well as to the level of total tax revenues.
Figure 1 The equalising effect of taxes and transfers varies widely across OECD countries, even for similar levels of inequality before taxes and transfers
Note: The Gini index measures the extent to which the distribution of incomes among households deviates from perfect equal distribution. A value of zero represents perfect equality and a value of 100 extreme inequality. Redistribution is measured by the difference between the Gini coefficient before personal income taxes and transfers (market incomes) and the Gini coefficient after taxes and transfers (disposable incomes) in per cent of the Gini coefficient before taxes and transfers. For Hungary, Mexico and Turkey household incomes are only available net of personal income taxes, implying that inequality can only be measured after taxes and before transfers. The three countries are not included in the OECD average. Working-age populations include all individuals aged 18-65. Data refer to 2012 for Japan; 2015 for Chile, Finland, Israel, Korea, the Netherlands, the United Kingdom and the United States; and 2014 for the rest.
Source: OECD Income Distribution Database.
At the same time, size is not enough to explain income redistribution, for instance because it says little about the extent to which social spending accrues to the least affluent households (Figure 2). For example, in Greece, Italy, Portugal, and Spain, 10% or less of total transfers accrues to bottom quintile households, by contrast with more than 40% in Australia, Finland, and New Zealand.
Figure 2 Targeting of cash transfers to low-income households differs across OECD countries
Notes: 1. Armed forces pension and older pension system not included. Data specially provided by Chilean statistical sources. Data refer to 2012 for Japan; 2015 for Chile, Finland, Israel, Korea, the Netherlands, the United Kingdom and the United States; and 2014 for the rest.
Source: OECD Income Distribution Database.
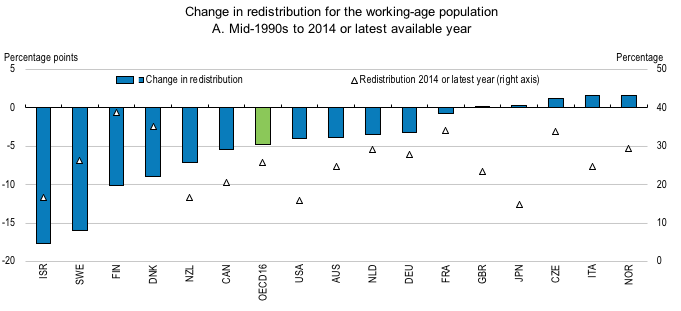
Since the mid-1990s, the redistributive effect of taxes and transfers has declined, both on average and in the majority of OECD countries for which data are available (Figure 3, Panel A). The trend towards less redistribution was most pronounced over the pre-crisis period (1995-2007), and was temporarily reversed during the first period of the crisis (2007-2010), reflecting the cushioning impact of automatic stabilisers and fiscal discretionary measures. Trends in redistribution were more heterogeneous over the most recent decade, with increases in around half of OECD countries, in particular those hardest hit by the crisis (Figure 3, Panel B).
Figure 3 Redistribution has declined for almost all available OECD countries since the mid-1990s
Notes: For Panel A data refer to 1994-2015 for the United Kingdom; 1995-2012 for Japan; 1995-2015 for Finland, Israel, the Netherlands and the United States; 1996-2014 for Czech Republic and France; and 1995-2014 for the rest. For Panel B data refer to 2003-2012 for Japan; 2003-2014 for New Zealand; 2004-2015 for Finland and the United Kingdom; 2005-2014 for Denmark, France and Poland; 2005-2015 for Israel, the Netherlands and the United States; 2006-2015 for Chile and Korea; and 2004-2014 for the rest. See note to Figure 8 for further details on redistribution measure and working-age population.
Source: OECD Income Distribution Database.
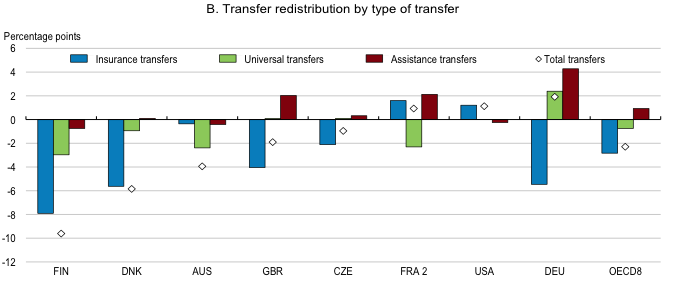
By and large, the decline in overall redistribution across OECD countries over the last decades has been primarily driven by a decline in redistribution by cash transfers, which is not surprising insofar as cash transfers account for the bulk of redistribution.2 Personal income taxes also contributed, but played a less important and more heterogeneous role across countries (Figure 4, Panel A). In turn, the decline in transfer redistribution was largely driven by insurance transfers (e.g. unemployment insurance, work-related sickness, and disability benefits). This was partly mitigated by assistance transfers (e.g. minimum income transfers, means- or income-tested social safety net) in some countries such as Germany and the UK (Figure 4, Panel B). Assistance transfers are less redistributive than insurance transfers in many OECD countries, for instance due to low take-up but also due to relatively low benefit amounts, so that their size is generally smaller than insurance transfers. As a result, the decline in transfer redistribution was largely driven by a decline in the size of transfers (i.e. transfer rate averaged across all households).
Figure 4 The redistributive effect of transfers has declined markedly across OECD countries
Notes: 1. Sweden only available for 1995-2005. 2. Social security contributions not available for France. Data refer to 1993-2013 for the Netherlands; 1994-2010 for Canada and France; 1994-2012 for Hungary; 1994-2013 for Germany, the United Kingdom and the United States; 1995-2000 for Belgium; 1995-2005 for Sweden; 1995-2010 for Australia; 1995-2013 for Denmark, Finland and Norway; 1996-2012 for Mexico; 1996-2013 for Czech Republic; 1997-2012 for Israel and Slovenia.
Source: Authors' calculations based on the Luxembourg Income Study.
Declines in the size of personal income taxes and social security contributions (i.e. tax rate averaging across all households) tended to reduce redistribution. However, in some countries like the Czech Republic and the UK, this was compensated by an increase in their progressivity (Figure 5), driven by tax changes at the low end of the earnings distribution. These counteracting changes in size and progressivity of personal income taxes tended to shape redistribution with fairly-equal forces, in contrast to transfers for which changes in size tended to dominate over changes in targeting.
Figure 5 Declines in the size of personal income taxes in most OECD countries tended to reduce redistribution
Notes: 1. Sweden only available for 1995-2005. 2. Social security contributions not available for France.
Source: Authors' calculations based on the Luxembourg Income Study.
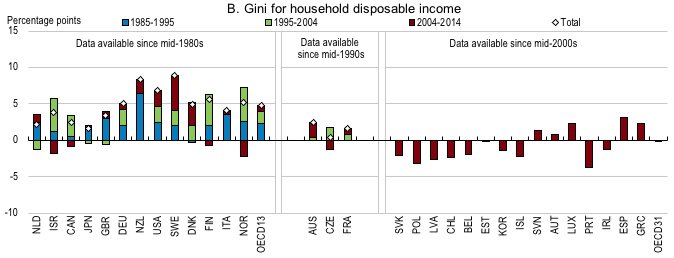
The decline in redistribution over the last two decades documented here took place in a period of flattening market income inequalities – indeed, in many OECD countries redistribution has declined by a sufficient margin to push up inequality after taxes and benefits despite a mild decline or stagnation in market income inequality. A longer-term perspective illustrates the point, based on developments in OECD countries for which data are consistently available over time (see Figure 6):
- Tax and transfer systems mitigated around half of the rapid and substantial rise in market income inequality from the mid-1980s to the mid-1990s, as market income inequality increased by almost 5 Gini points and disposable income inequality by around 2.3 Gini points on average.
- By contrast, from the mid-1990s to the mid-2000s, market income inequality slowed down, as the rise in the Gini coefficient was less than 0.3 on average. At the same time, disposable income inequality continued to rise in the majority of countries and the change in the Gini coefficient was around 1.7 on average. In other words, compared to the previous decade, tax and transfer systems achieved less inequality reduction and in some cases, such as Finland and Israel, they delivered increased inequality.
- From the mid-2000s to the last available year, there was little change in either market or disposable income inequality, on average. Still, this covers heterogeneous developments across countries, to some extent reflecting differences in the extent to which the 2008-09 recession affected unemployment.
Figure 6 Market income inequality has been flattening since the mid-1990s, while disposable income inequality continued to rise until the mid-2000s
Notes: Data for 1985 refer to 1983 for Sweden; 1984 for Italy and the United States; and 1986 for Finland and Norway. Data for 1995 refer to 1994 for the United Kingdom; and 1996 for Czech Republic and France. Data for 2004 refer to 2003 for Japan and New Zealand; 2005 for Denmark, France, Israel, the Netherlands, Poland and the United States; and 2006 for Chile and Korea. Data for 2014 refer to 2012 for Japan; and 2015 for Chile. A change in the income definition implies a break in the series around 2011 for some countries and an estimated series correcting for the break have been used.
Source: OECD Income Distribution Database.
Policy implications
There are number of potential explanations for the decline in redistribution, pointing to policy and non-policy drivers, along with their interaction:
- Policy reforms to boost work incentives among target groups and to shift from passive to active support for the unemployed. Over the last decades, many OECD countries have implemented welfare reforms aimed at boosting work incentives, especially for socioeconomic groups with weak labour market attachment. The focus has been on activation and conditionality within the ‘mutual obligation’ framework, which has often implied a tightening of eligibility conditions or a reduction in the duration of unemployment benefits. Reforms have also aimed at increasing labour supply by reducing labour taxes and social security contributions for low-income workers, including through earned income tax credits.
- Changes in the nature of work. Non-standard type of contracts have accounted for a significant share of new job creation in many OECD countries over the last two decades. Such structural changes may have contributed to a decline in redistribution. The reason is that a rising proportion of workers is likely to lack income protection in the event of a job loss (or sickness), which reflects the fact that non-standard workers often fail to meet eligibility criteria, for instance because of short tenures or self-employment status.
- Changes in the age composition of the working-age population and rising employment rates among seniors. Over the last decades, all OECD countries have experienced a marked increase in the share of senior households (individuals aged 55-64) in the working-age population, and at the same time, employment rates among seniors have increased in most OECD countries. This has contributed to employment growth and is likely to have mitigated market income inequalities, but at the same time has significantly contributed to the reported decline in redistribution.
Concluding remarks
To sum up, one notable finding from our paper is a marked decline in the size of transfer systems across OECD countries over the last two decades. This was largely driven by insurance-based transfers, with income protection tending to shift to assistance-based transfers in some countries, resulting in an increase in the targeting of transfers overall. Yet more targeted transfers did not generally deliver more redistribution because increased targeting was in most cases combined with decreased size. In this context, one overarching policy challenge is to design cost-effective transfer redistribution, one issue being enhancing the redistributive effects of assistance transfers that are targeted by design because of conditionality or means-testing.
Another notable finding is a shift from out-of-work to in-work transfers, at least partly driven by reforms to make work pay, especially for those with weak labour market attachment. While this is likely to have mitigated market income inequalities by spurring employment growth, it could have contributed to the decline in redistribution. This raises the key policy challenge of designing tax and transfer systems to achieve income redistribution but also to strengthen incentives for labour market participation and up-skilling.
That the decline in redistribution may, to some extent, reflect the effects of efficiency-oriented tax and transfer reforms should not lead to the conclusion that countries have no choice but to trade more efficiency for less equity. Rather, it may indicate that countries make different policy choices, reflecting different economic and social context but also different preferences. The cross-country correlation between GDP per capita and redistribution is very weak because equally-affluent countries achieve very different levels of redistribution through taxes and transfers. For instance, Austria, Denmark, Ireland, Switzerland, and the US are all ranked among the top OECD countries in terms of GDP per capita. Yet Austria, Ireland, and Denmark are among the most redistributive OECD countries, while Switzerland and the US are among the least. One interpretation would be that countries do have policy options to strengthen efficiency and growth without having to give up on equity, and that some economic models or welfare systems can deliver on both equity and efficiency.
More fundamentally, the finding that the decline in redistribution may to some extent reflect the effects of efficiency-oriented tax and transfer reforms would fail to consider redistribution policies as part of broader policy packages to make growth more inclusive. Tax and transfer reforms should be designed within an array of complementary policy instruments to address equity and efficiency objectives, taking into account country-specific context, constraints, and social preferences.
Authors’ note: The views expressed here are those of the authors and do not necessarily reflect those of the institutions they represent.
References
Causa, O and M Hermansen (2017), “Income redistribution through taxes and transfers across OECD countries”, OECD, Economics Department Working Papers No 1453.
Fournier, J M and A Johansson (2016), “The effect of the size and the mix of public spending on growth and inequality”, OECD, Economics Department Working Papers No 1344.
Immervoll, H and L Richardson (2011), “Redistribution policy and inequality reduction in OECD countries: What has changed in two decades?”, OECD, Social, Employment and Migration Working Papers No 122.
International Monetary Fund (2017), Fiscal Monitor: Tackling Inequality, Washington, October.
Joumard, I, M Pisu and D Bloch (2012), “Tackling income inequality: The role of taxes and transfers”, OECD, Journal: Economic Studies Vol 2012/1.
Lindert, P H (2017), “The rise and future of progressive redistribution”, Commitment to Equity Institute, Working Paper 73.
OECD (2008), Growing Unequal? Income Distribution and Poverty in OECD countries, OECD Publishing, Paris.
OECD (2011), Divided We Stand: Why Inequality Keeps Rising, OECD Publishing, Paris.
OECD (2015), In It Together: Why Less Inequality Benefits All, OECD Publishing, Paris.
OECD (2017), “Basic income as a policy option: Can it add up?”, Policy Brief on the Future of Work, OECD Publishing, Paris.
World Inequality Lab (2017), World Inequality Report 2018.
Endnotes
[1] Relevant work in this area includes Immervoll and Richardson (2011), OECD (2008, 2011, 2015), Joumard et al. (2012), Fournier and Johansson (2016), and Lindert (2017).
[2] On average across the OECD, around 72% of inequality reduction is achieved through cash transfers.


