Slowing labour productivity growth for any given income share of labour directly translates into a slower growth rate of real wages and a nation’s standard of living. Each percentage point by which productivity growth declines translates into the same reduction in the growth rate of potential output, reducing a nation’s capacity to finance national security, education, healthcare, and old-age pensions.
Tepid rates of productivity growth below 1% in both the US and Western Europe since 2005 have raised the spectre of secular stagnation, blamed variously on lagging innovation, low investment, growing corporate concentration, reduced business dynamism, and rising income inequality. The productivity slowdown has taken centre stage in monetary policy deliberations through the downward pressure it has exerted on the real natural rate of interest, giving central banks less room to drop rates to combat future recessions. For example, estimates of the US natural rate by the Federal Reserve Bank of New York (2019) based on work by Laubach and Williams (2003) show a decline from over 4% in the 1970s to under 1% in the 2010s.
A notable contrast across the Atlantic is the speedup of US productivity growth from 1.25 percentage points per year in 1972-1995 to 2.17 points in 1995-2005 – commonly attributed to widespread adoption of PCs, the internet, and other information and communications technology (ICT) – versus a slowdown over the same intervals from 2.31 to 1.26 percentage points in an aggregate of 10 Western European nations (the EU10).1 Explanations for why Americans seemingly benefited more from ICT adoption than Europeans often appeal to country-specific factors such as differences in incentives for innovation or labour market institutions.
Our recent research (Gordon and Sayed 2019) takes a different view, suggesting that the slowdowns in US and European growth have more in common than previously recognised. We utilise new industry-level data from the US and the EU10 to compare productivity growth across time intervals divided in 1972, 1995, and 2005. We emphasise the contributions of specific industries to growth in labour productivity and its three growth-accounting components – investment (capital deepening), multifactor productivity (measuring innovation and technological progress), and labour quality.2
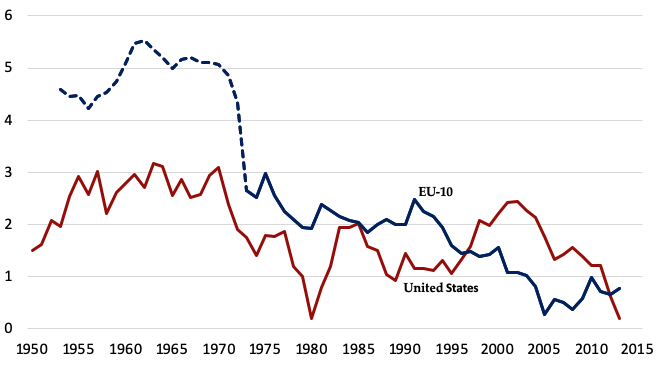
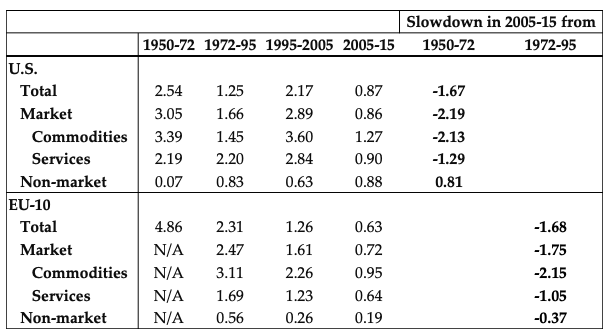
Figure 1 displays the annual growth rates of output per hour since 1950 for the total US economy in red and an aggregate of the EU10 in blue.3 Averages over selected intervals are listed in Table 1. US productivity growth averaged 2.54 percentage points per year from 1950-1972, fell to 1.25 points from 1972-1995, rebounded to 2.17 between 1995 and 2005, and finally fell to 0.87 points during 2005-2015. Instead of experiencing the same up-down-up-down pattern as the US, Table 1 shows that the EU10 experienced a continuous slowdown, with average annual productivity growth averaging 4.85 percentage points from 1950-1972, slowing to 2.31 during 1972-95, falling again to 1.26 between 1995-2005, and finishing at 0.63 points during 2005-15.
Figure 1 US vs. EU10 total economy labour productivity growth 1950-2015, centred five- year moving averages
Source: EUKLEMS data except for EU10 1950-72 for the total economy, which is GDP per hour from the Conference Board Total Economy Database, weighted together for the ten EU nations using real GDP weights.
Table 1 Annual average growth rates of labour productivity by sector, selected intervals, 1950-2015
Source: All cells are computed from the merged KLEMS database except for the EU10 in 1950-72, which comes from the Conference Board Total Economy Database.
The postwar history of the transatlantic productivity comparison can be told either with growth rates or comparative levels of labour productivity, which can be measured as purchasing-power-parity output divided by hours. The EU10 level in 1950 was just half that of the US, reflecting the economic dislocations of the two world wars and the interwar period, when the US level of productivity leapt ahead of Europe. By 1972, the level of European productivity had reached 81% of the US and soared further to 106% in 1995 before falling back to 90% in 2005.
These level data suggest that the burgeoning European productivity growth of 1950-1972 can be interpreted as catching-up to the pre-1950 accomplishments of the US. During 1972-1995, Europe slowed to a rate comparable to the initial 1950-72 postwar growth rate of the US. Timmer et al. (2011) similarly argue that European productivity played ‘catch up’ with the US from 1950-73 through technology and institutional imitation, with 1973-95 growth slowing as the EU ‘caught up’.
Table 1 shows that taking US labour productivity during 1950-1972 as isomorphic to that of the EU10 during 1972-1995 allows a new interpretation of postwar history. Between 1950-72 and 2005-15, US productivity growth slowed by 1.67 percentage points, while between 1972-95 and the same 2005-15 endpoint European growth slowed down by almost the same amount – 1.68 points. Similarly, an aggregate of commodities-producing industries (such as manufacturing, agriculture, and mining) slowed by 2.13 points in the US and 2.15 points in Europe, while an aggregate of services-producing industries (such as retail trade, communications, and finance) slowed by 1.29 points in the US and 1.05 points in Europe.
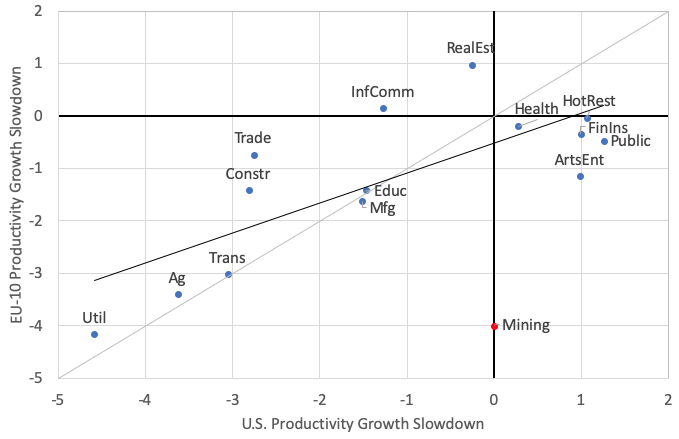
The strong correlation across industries in the extent of the slowdown is plotted in Figure 2. The vertical axis measures the change between 1972-95 and 2005-15 in the productivity growth rate of individual industries in the EU10, while the horizontal axis measures the slowdown for the same industries in the US between 1950-72 and 2005-15. Notice that seven of the 16 industries are plotted in the southwest quadrant, indicating a decline for both the US and the EU10. Five of these – utilities, agriculture, transportation, manufacturing, and education – lie on the grey 45-degree line, indicating exactly the same slowdown on both sides of the Atlantic. The correlation coefficient of the relationship in Figure 2 is 0.81 when the outlier mining industry is excluded.
Figure 2 Regression of EU10 1972-95 to 2005-15 productivity slowdown on US 1950-72 to 2005-15 productivity slowdown
When dividing the economy between commodities-producing industries and those producing services, commodities dominate changes across intervals in the US. Commodities contributed to the entirety of the US slowdown after 1972, falling from 3.39 percentage points per year to 1.45, while services experienced no net change. The revival of US productivity growth after 1995 was also mostly due to a 2.15-point rise for commodities as opposed to a revival of only 0.64 points for services. The post-2005 US slowdown was shared between commodities and services, both slowing by about 2 percentage points. In Europe, growth in commodities and services slowed after 1995 and 2005, but the slowdown in annual commodities growth was almost twice as large (2.15 percentage points) as that in services (1.05 points).
As noted above, labour productivity growth can be divided into three components – capital deepening, multifactor productivity growth, and the contribution of labour quality. Ignoring the latter as relatively unimportant, we can investigate how capital deepening contrasted with multifactor productivity growth as a source of overall productivity growth. For the US, the contribution of capital deepening was relatively steady before 2005, and so the changes in productivity growth across time intervals largely mirrored changes in multifactor productivity growth, which explains 1.03 of the 1.29-point post-1972 slowdown and 0.71 of the 0.92-point post-1995 revival. In contrast, multifactor productivity growth explains only 0.53 points of the 1.30-point post-2005 slowdown. Data for the EU10 reveal a roughly co-equal role of multifactor productivity growth and capital deepening in explaining both the post-1995 and further post-2005 productivity growth slowdowns.
This pattern of changes in multifactor productivity growth supports our broad theme that the industry anatomy of the productivity slowdown was similar across the Atlantic. Contrasting the slowdown ending in 2005-15 and starting from 1950-72 in the US, and 1972-95 in the EU10, we find that five of the six industries with the largest slowdowns in multifactor productivity growth are the same in both regions –agriculture, transportation, utilities, construction, and manufacturing. Four of the six manufacturing sub-industries with the largest multifactor productivity slowdowns are also the same – chemicals, petroleum, food, and machinery not elsewhere classified. Combined with the tight correlation between the magnitudes of slowdowns of US and European industries, this suggests that falling multifactor productivity growth explains both the magnitude and composition of falling productivity growth on both sides of the Atlantic. This supports our theme that a diminished role of innovation, not slowing investment, is the most important underlying cause of the transatlantic productivity growth slowdown.
One interesting difference between the US and Europe is the contribution of the electronics manufacturing industry to aggregate productivity growth. In the US, this industry achieved productivity growth of 13.5 percentage points a year from 1972-1995, 17.6 points from 1995-2005, and then fell to (still impressive) 7.07 points after 2005. European electronics manufacturing growth during the same three periods was much slower – only 5.47, 4.78, and 2.95, respectively. Beyond electronics, another outlier in the data appears to be mining in the US, the only industry to see a meaningful rise in productivity growth from -1.87 in 1995-2005 to 2.98 in 2005-2015, likely due to the development of fracking that did not occur in Europe (where growth in mining productivity was negative before and after 2005). Additionally, chemicals manufacturing appears to be an outlier due to its stronger productivity growth in Europe across all time periods.
Despite these differences, our findings shed a new light on the transatlantic productivity slowdown by highlighting some striking similarities between the US and Europe. The industrial composition of the slowdown was similar in Europe and the US, and we point to decelerating technical change as the primary driving force in the transatlantic slowdown. Fluctuations in commodities-producing industries explain more of the period-to-period slowdowns of each region than do services-producing industries. Further insight into the sources of the productivity slowdown will need to be fought in the trenches of detailed studies of individual industries, and our study has helped to point to those particular industries that are most in need of further insight and evaluation.
References
Federal Reserve Bank of New York (2019), “Measuring the natural rate of interest”.
Gordon, R J and H Sayed (2019), “The industry anatomy of the productivity growth slowdown in the US since 1950 and in Western Europe since 1972”, CEPR discussion paper 13751.
Laubach, T and J C Williams (2003), “Measuring the natural rate of interest”, Review of Economics and Statistics 85(4): 1063-70.
Timmer, M P, R Inklaar, M O'Mahony and B Van Ark (2011), “Productivity and economic growth in Europe: A comparative industry perspective”, International Productivity Monitor 21: 3-23.
Endnotes
[1] The ten nations are Austria, Belgium, Denmark, France, Germany, Italy, Luxembourg, the Netherlands, Spain, Sweden, and the UK.
[2] Our data decompose total economic activity into 16 industries, 12 of which are in the market sector and four of which are in the nonmarket sector. We also have a further decomposition of the manufacturing sector into 11 manufacturing sub-industries.
[3] All references to productivity growth in this column refer to the total economy including agriculture, government, and households, not the more commonly cited productivity data for the nonfarm private business sector. Total economy productivity growth is always slower than in the nonfarm private business sector, but by varying amounts.


