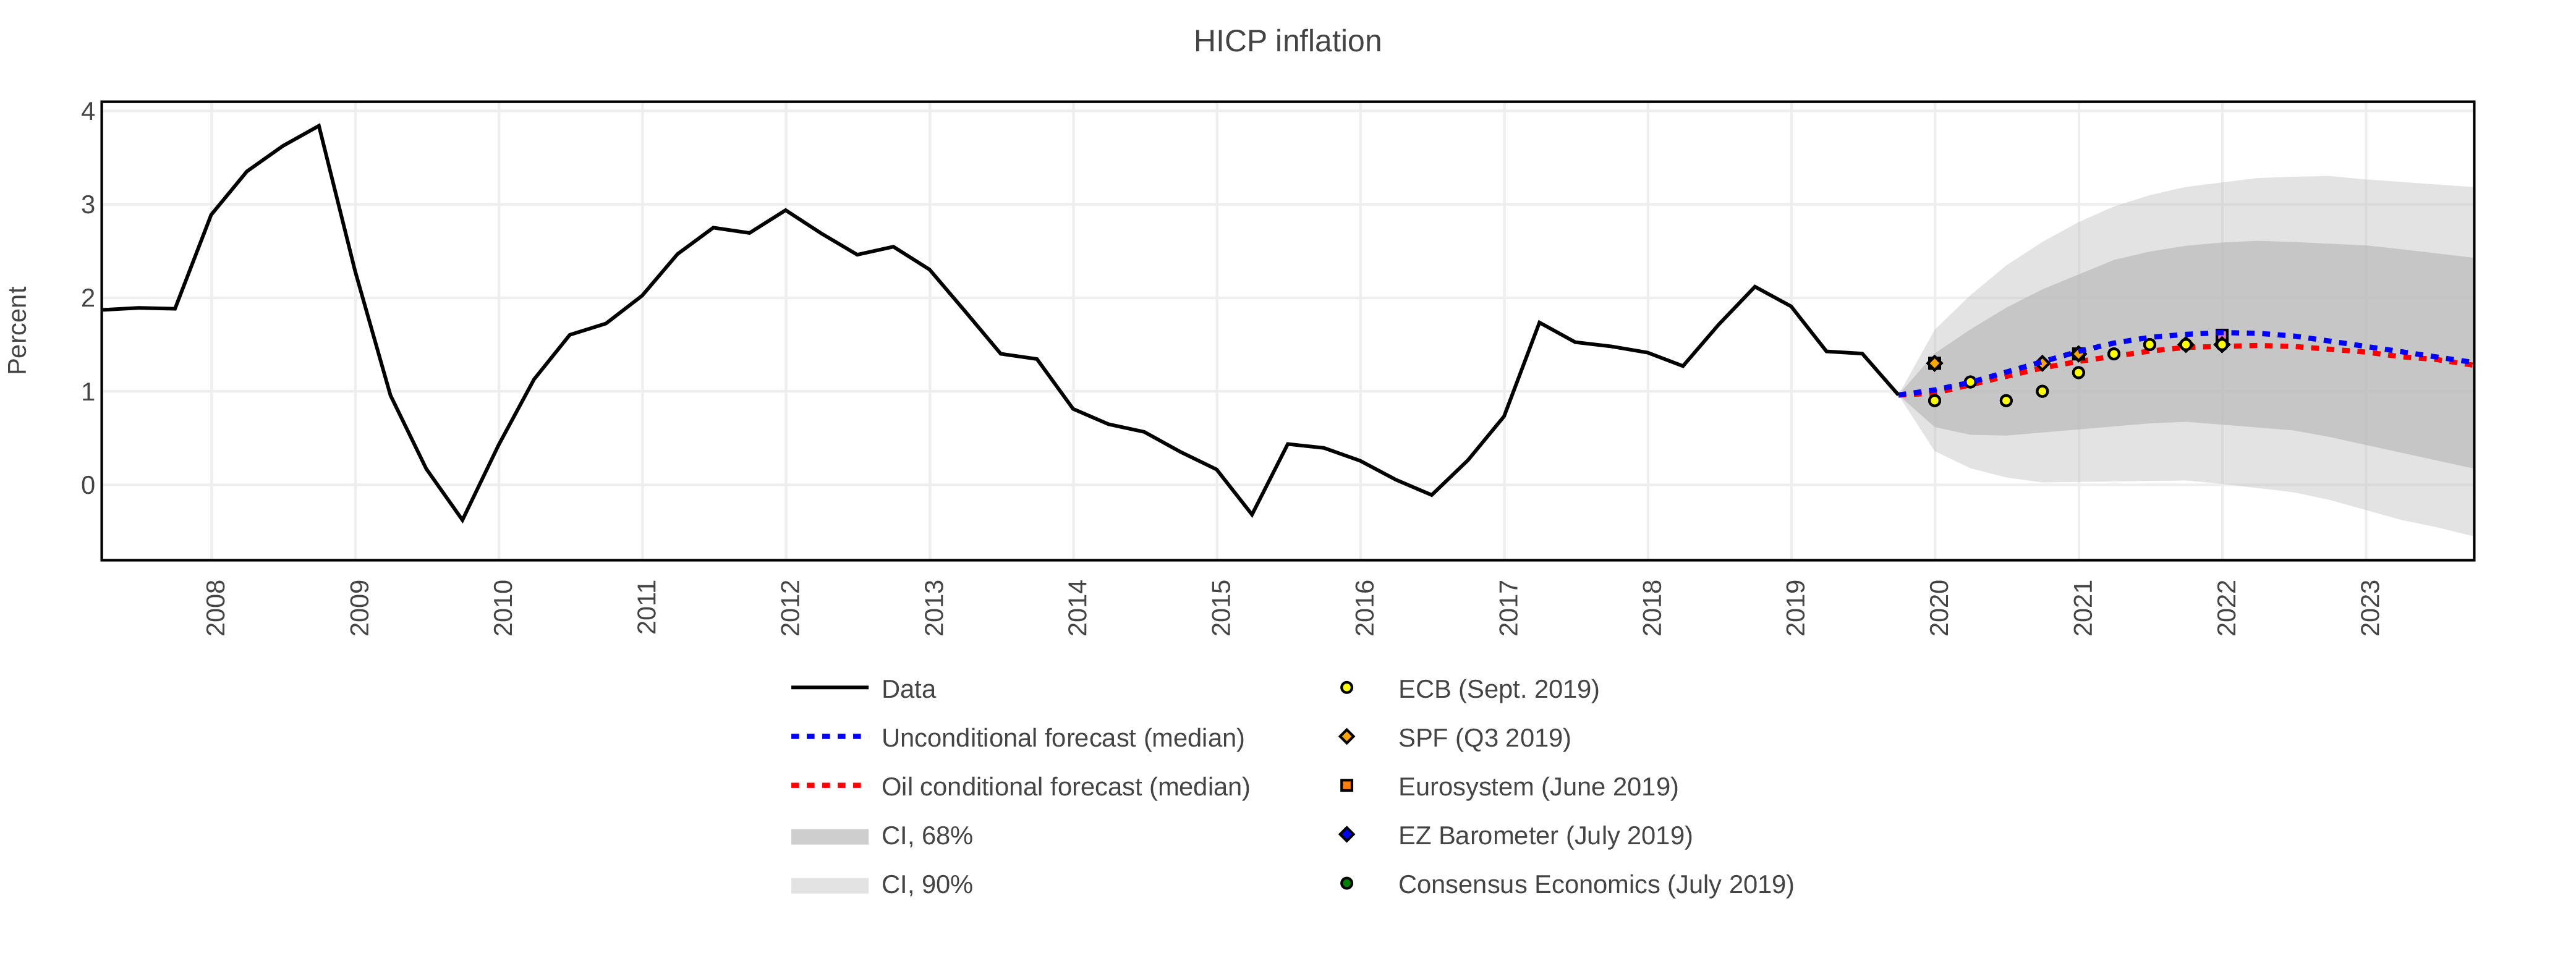
The latest ECB projection for headline inflation (HICP) points to a sharp downward revision of what forecasted two years ago (ECB 2017, 2019). For example, this year inflation was projected to be 1.5% while it is now estimated to be at 1.2%. The corresponding numbers for 2020 are 1.7% and 1%, respectively.
In January 2018 we wrote a Vox column in which we forecasted euro area headline inflation to be 1.1% this year and to remain close to 1% for the next five years. That forecast was based on our semi-structural model for US inflation (Hasenzagl et al. 2018a) adapted to fit euro area data. At the time we were much more pessimistic than the ECB’s own forecasts but in line with market expectations (Hasenzagl et al. 2018b)
In this column we ask two questions. First, with the benefit of almost two years of additional data, has our view changed? Second, what does the answer imply for our estimates of the Phillips curve and the output gap in the Union?
The answer to the first question is negative. Our forecast for this year is in line with what predicted two years ago and points to 1.48% for Q4-2022. This is close to what the ECB projects for 2021.
Figure 1 Quarterly year-on-year HICP inflation and forecasts
Notes: Forecast period, indicated with a shaded area, is Q4-2019 to Q3-2023. The red line shows the authors’ prediction conditional to the term structure of oil futures prices.
Sources: ECB, ECB SPF, Eurosystem, EZ Barometer, Consensus Economics and authors’ calculations.
To answer the second question, we can use the model to obtain a coherent view. Indeed, our framework produces estimates of a number of structural estimates – potential output, the output gap, the Okun law, an energy price cycle – and decomposes inflation into a cycle explained by the Phillips curve connecting the output gap to prices, an energy component related to oil prices, and its trend that is identified as the long-term inflation expectation.
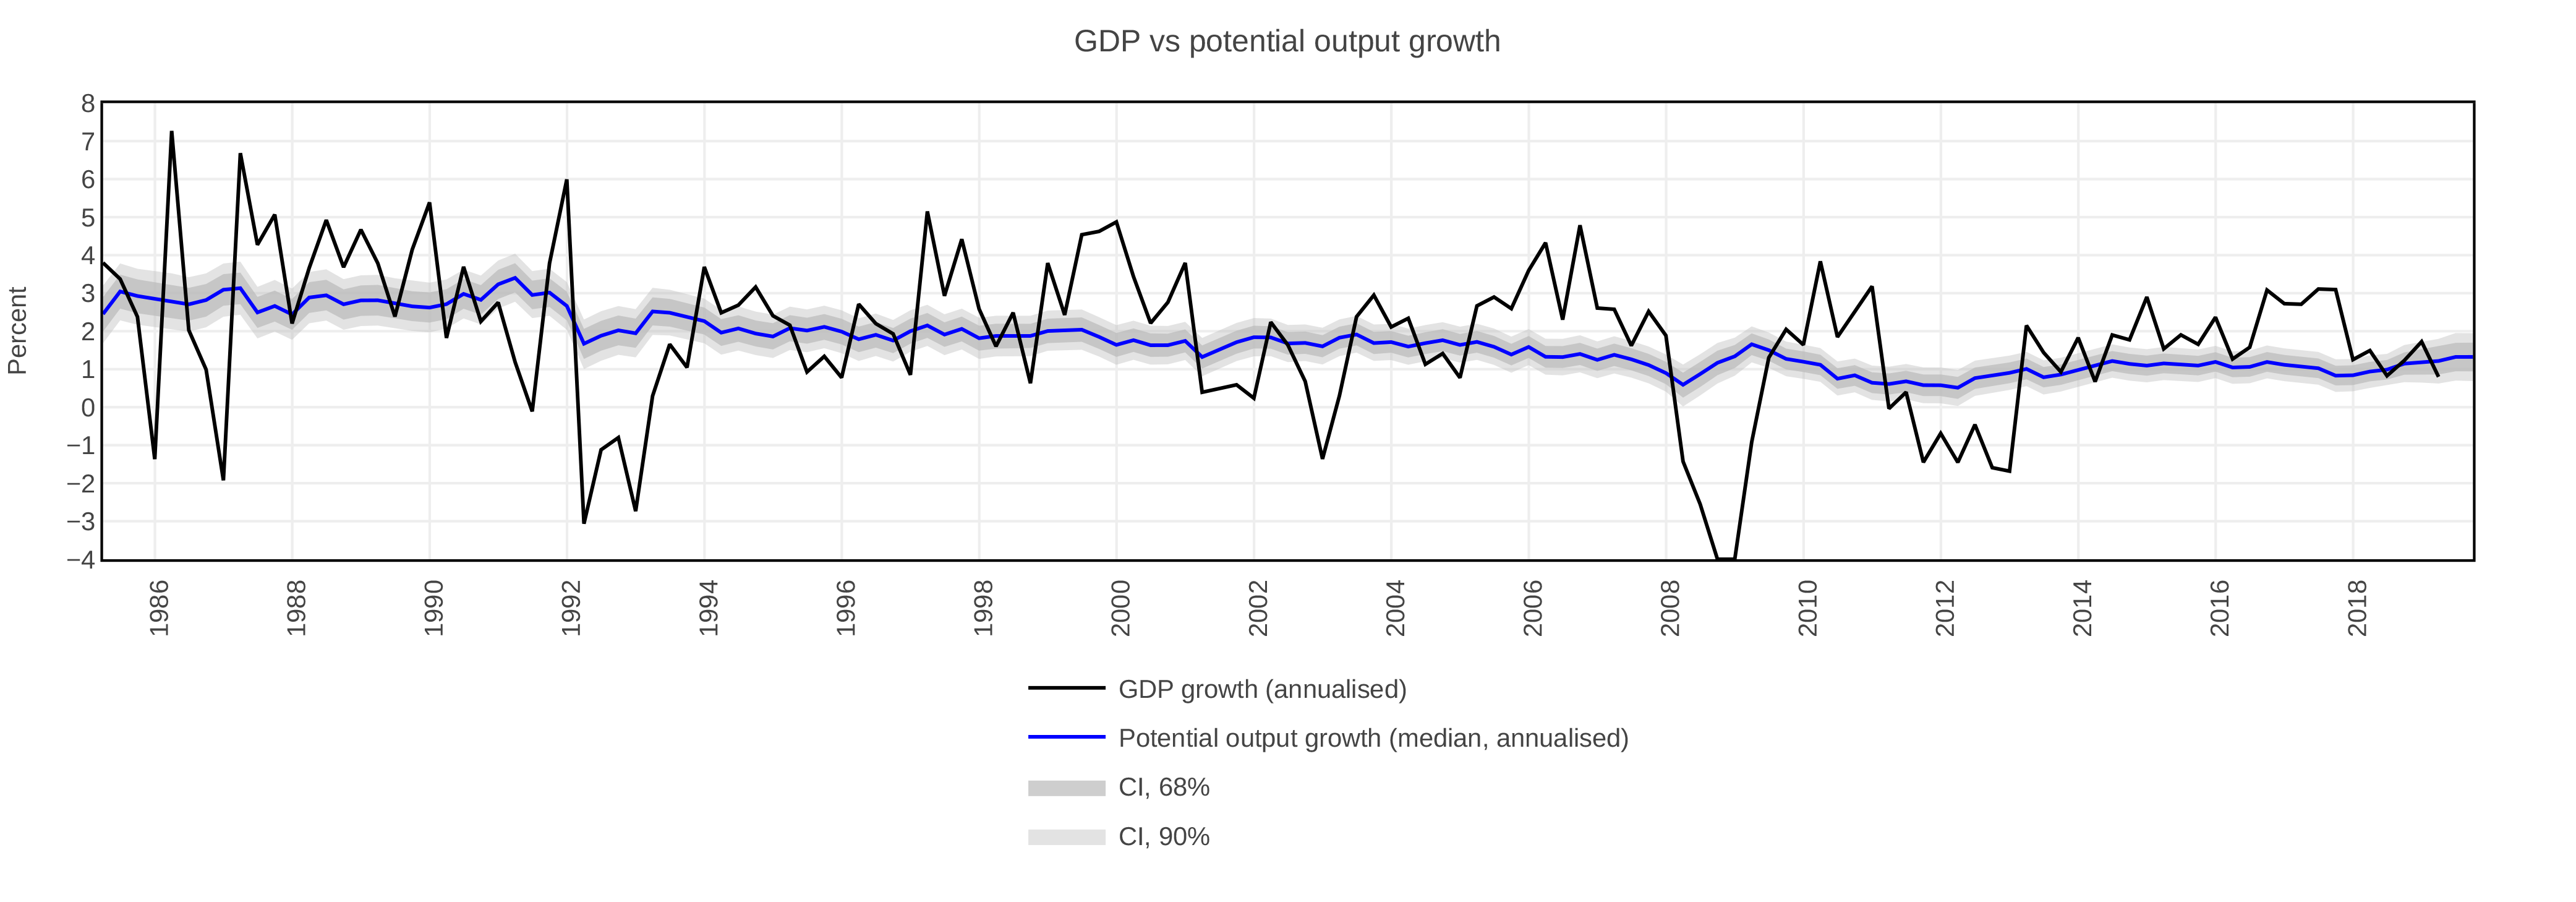
Figure 2 reports our estimate of the output gap against the IMF, European Commission and Bloomberg estimates and Figure 3 our rate of growth of potential output (trend output).
Figure 2 Output gap as percentage of potential GDP for the euro area
Sources: Bloomberg, IMF, European Commission – all annual data interpolated at quarterly frequency – and authors’ calculations.
Figure 3 GDP growth and potential output growth (annualised) for the euro area
Note: Potential output growth is the (one-sided) four-quarters moving average of the annualised GDP trend growth.
Source: authors’ calculations.
Our measure of the output gap is quite correlated with institutional measures. It implies an adaptive trend which shows a steady decline since the beginning of our sample in the mid-eighties and an additional persistent slowdown since the Global Crisis (potential growth is now estimated to be at 1%). The latter, in line with the view that deep recessions create hysteresis in real economic activity (e.g. Galì 2015), we attribute the slowdown of average output growth since the crisis to the trend rather than to the cycle. This view is also supported by the observation that the 2008 recession is associated with a persistent fall in private investment, which is at odds with past business cycle regularities (Caruso et al. 2019).
Our model implies a relatively steep Phillips curve if compared to the literature’s estimates that find that it has weakened or even disappeared (e.g. Ball and Mazumder 2011, IMF 2013, Hall 2013). However, since the output gap is relatively small and, at the present, energy price has a neutral effect on headline inflation, the current dynamics of inflation is mostly explained by its trend. Figure 4 reports the decomposition of the cyclical component of HICP inflation into energy (red), business cycle (blue) and noise (yellows) and makes the point.
Figure 4 Quarterly year-on-year CPI cycle, historical decomposition
Note: Forecast period is indicated with a dashed line, and goes from Q4-2019 to Q1-2024.
Source: authors’ calculations.
This view of the euro area macroeconomic dynamics can be summarised as follows.
We still have a positive output gap which is close to peak (first quarter of 2020) and the economy is now expected to return to trend growth which is estimated to be about 1%. Inflation decline is mostly to be attributed to its trend component, which we identify as long-term expectations. The Phillips curve, although steep, contributes little upward pressure since the decline of output growth is in largely due to a downward adjustment of output potential.
Although much of the policy discussion has focused on the Phillips curve and the economic cycle, what needs to be understood are the trends. This is true for both output and inflation.
As for policy implications, the point of attention in the euro area should be the fact that inflation expectations (the trend) have been declining since early 2014 and, notwithstanding some volatility, is expected to remain lower than target for a long time. Delayed monetary policy action in 2012-2014 maybe an explanation. Interestingly, our US estimates point to a higher inflation trend (Hasenzagl et al. 2018b) and this is also supported by the dynamics the inflation expectations at five-year horizons by professional forecasters, as reported in Figure 5.
Figure 5 Survey of professional forecasters for the US and the euro area at five-year horizons (mean)
Sources: ECB, Philadelphia Fed.
An interesting venue for reflection is the understanding of the common causes of declining trend output growth and trend inflation. Legacy debt and risk aversion, which are the consequence of the Global Crisis, as well as uncertainty related to a deep transformation of our economies, from climate change to technology to ageing, may weight on both output and inflation in a persistent way. This calls for non-standard monetary and fiscal policy addressing nominal GDP trends.
Note also that the same forecast of inflation could have been obtained by a model with a larger output gap (and steeper GDP trend) but a flatter Phillips curve (e.g. Jarociński and Lenza, 2018). Therefore, the question at hand is not how steep the Phillips curve really is but whether we believe in a world with a steep Phillips curve and declining potential output growth, or in a world with a flat Phillips curve and constant potential output growth.
References
Ball, L, and S Mazumder (2011), “Inflation Dynamics and the Great Recession”, Brookings Papers on Economic Activity 42(Spring): 337–381.
Caruso, A, L Reichlin and G Ricco (2019), “Financial and Fiscal Interaction in the Euro Area Crisis: This Time was Different”, European Economic Review 119: 333-355.
European Central Bank (2017), “ECB Staff macroeconomic projections for the euro area”, December.
European Central Bank (2019), “ECB Staff macroeconomic projections for the euro area”, September.
Galí, J (2015), “Hysteresis and the European unemployment problem revisited”, ECB Forum on Central Banking, May.
Hall, R E (2013), “The Routes Into and Out of the Zero Lower Bound”, paper presented at the “Global Dimensions of Unconventional Monetary Policy” Federal Reserve Bank of Kansas City Symposium, Jackson Hole, Wyoming.
Hasenzagl, T, F Pellegrino, L Reichlin, and G Ricco (2018a), “Low inflation for longer”, VoxRU.org, 15 January.
Hasenzagl, T, F Pellegrino, L Reichlin and G Ricco (2018b), “A Model of the Fed’s View on Inflation”, CEPR Discussion Paper No. 12564.
IMF (2013), “The Dog that Didnt Bark: Has Inflation Been Muzzled or Was It Just Sleeping?”, Chapter 3 in Hopes, Realities, Risks. World Economic Outlook, April.
Jarociński, M and M Lenza (2018), “An Inflation‐Predicting Measure of the Output Gap in the Euro Area”, Journal of Money, Credit and Banking 50(6): 1189-1224.


