In March 2016, The Economist presented Africa as the land of 1.2 billion opportunities. Indeed, over the last few decades, education has been rising and living standards have been improving on the continent. Nonetheless, certain countries and regions face rampant conflict and persistent poverty. Anecdotal evidence and case studies suggest that the recent gains have not been equally distributed. Yet, a comprehensive examination of social mobility and opportunities across African countries and regions is lacking.
In recent work (Alesina et al. 2019a), we use individual-level data covering more than 20 million people, from 68 national censuses, spanning 26 African countries since the late 1960s to study intergenerational mobility in education across the continent. We reconstruct the joint distribution of parental and offspring education since the 1960s, when most parts of Africa became independent, and ask: where is the land of opportunity? How large are differences in intergenerational mobility across countries and regions? How large are gender disparities? How big is the rural-urban gap? Which elements of a region's history and geography correlate with educational mobility? Do regions matter for social mobility or do regions with higher mobility just attract families more eager to climb the social ladder?
African land of opportunity
In the first part of our paper, we construct and describe new cross-country and within-country measures of educational opportunity in Africa. As in recent US-centric works of intergenerational mobility in income (e.g. Chetty et al. 2014, Chetty and Hendren 2018a, b) and education (e.g. Card et al. 2018), we compile new statistics of upward intergenerational mobility defined as the likelihood that children born to parents that have not completed primary schooling will do so. Similarly, we map downward mobility, defined as the probability that offspring of parents with completed primary education fail to do so. To account for ‘selection on cohabitation’, we focus on children between 14 and 18 years old, as children in that age bracket have, by and large, finished primary school and still reside overwhelmingly with their parents (cohabitation rates are approximately 94%).
Mappings of intergenerational mobility across African countries and regions
Across countries
We uncover large cross-country variation in upward and downward mobility. Figures 1 provides a visualisation plotting of the variation across 2,809 regions. The likelihood that children born to parents with no education complete primary schooling exceeds 70% in South Africa and Botswana. The corresponding statistic in Sudan, Ethiopia, Mozambique, Burkina Faso, and Malawi hovers below 20%.
Figure 1a Upward intergenerational mobility across Africa
(brighter colour = higher mobility)
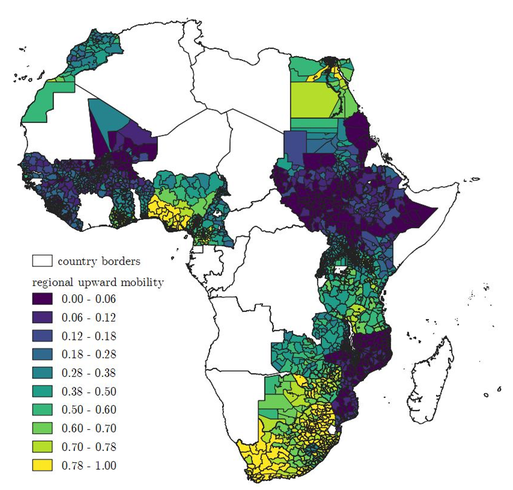
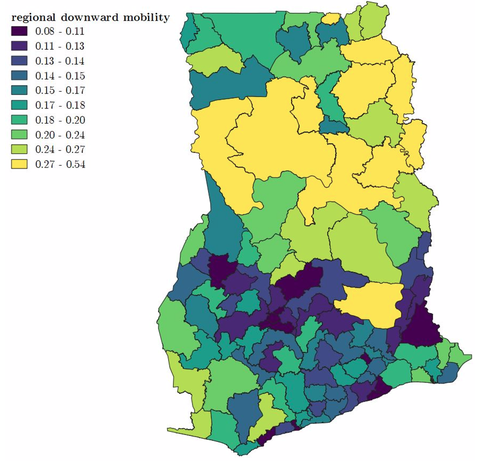
Figure 1b Downward intergenerational mobility across Africa
(brighter colour = higher mobility)
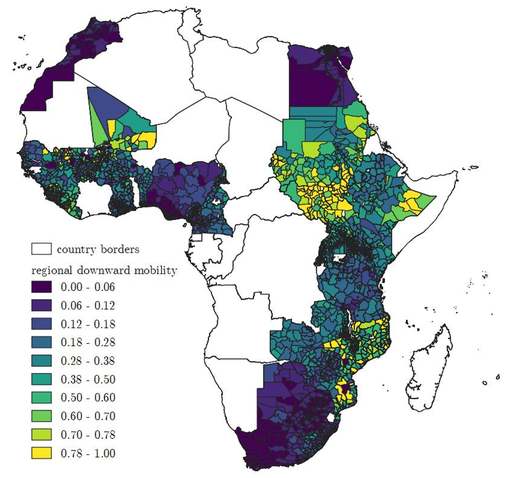
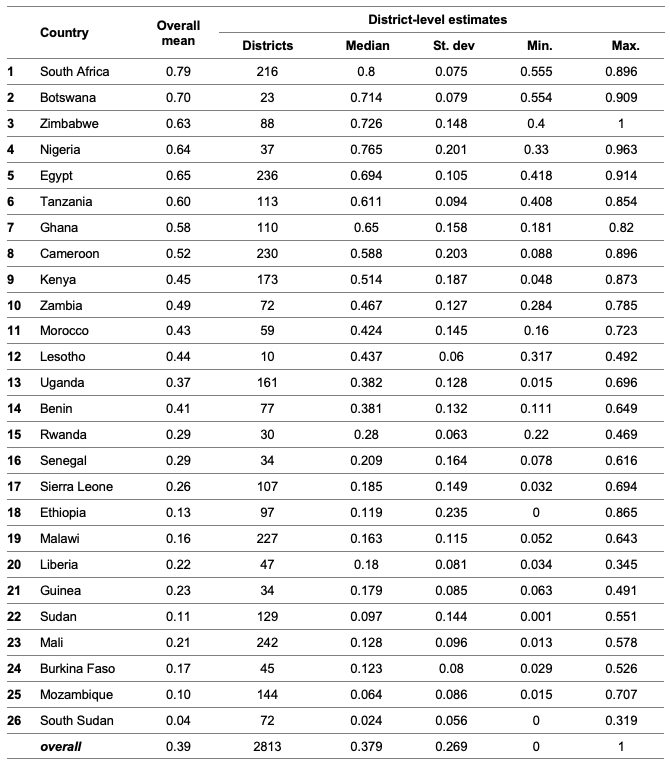
Table 1 reports the country averages, as well as the regional disparities within each country (median, standard deviation, minimum and maximum). The figure shows that in South Africa, the likelihood that children born to parents with no education complete primary schooling is 79%, while it is 4% in South Sudan.
Table 1 Upward intergenerational mobility in education
Within countries
Figure 2 zooms in on Ghana. While average upward intergenerational mobility is 0.58, regional intergenerational mobility ranges from 0.18 to 0.82, with rates below 0.4 across the Northern regions and above 0.7 in the South. The mean downward mobility is 0.20, but also greatly varies from 0.08 to 0.50. This north-south gradient mirrors the country's religious geography and colonial-era missionary activity and transportation investments. Ghana is by no means unique. Regional variation in intergenerational mobility is substantial in other countries (Table 1). For example, in Burkina Faso the average upward-IM of 0.132 masks huge variability with regional intergenerational mobility ranging from 0.028 to 0.52. In Uganda, the range of intergenerational mobility is even wider (0.015-0.69). In Cameroon, a child born to illiterate parents has a 52% probability of completing primary education on average. Yet, where the family resides plays a critical role; in some districts, upward mobility is nearly guaranteed whereas in others it is almost impossible.
Figure 2a Upward intergenerational mobility across Ghana
(brighter colour = higher mobility)
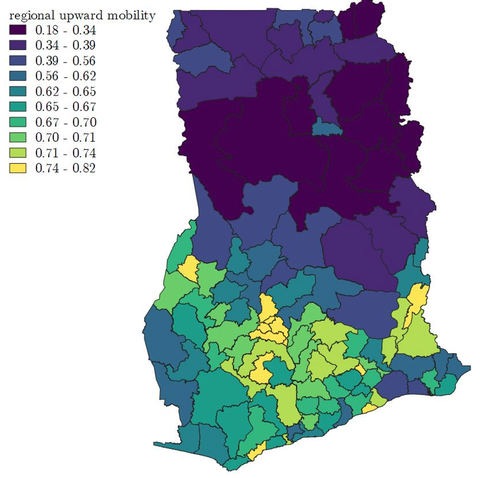
Figure 2b Downward intergenerational mobility across Ghana
(brighter colour = higher mobility)
Dynamics over time
We compile statistics for different cohorts to study dynamics over time. Pan-African upward intergenerational mobility has somewhat increased since independence, though in many countries and regions there have been no major changes. This has resulted into a widening of regional differences in social mobility across time, a pattern illustrated in Figure 3.
Figure 3 Distribution of regional intergenerational mobility across cohorts
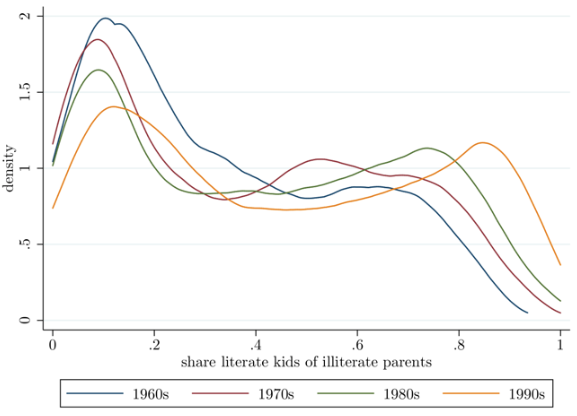
In spite of these modest changes, intergenerational mobility is highly persistent across time (cohorts). The correlation between the 1990s and the 1970s-born cohorts exceeds 0.80. The regions (and countries) with relatively higher mobility in the 1970s (and earlier) are the ones that have high upward mobility 20 years later.
Cross-sectional patterns and variation
Intergenerational mobility correlates strongly with the average parental education in the country/region, upward mobility is higher and downward mobility lower in countries and regions where the old generation is on average more educated. These patterns suggest slow educational convergence (or even poverty-trap dynamics). Figure 4 illustrates the strong positive association between upward intergenerational mobility and the old generation’s education across districts.
Figure 4 Literacy and intergenerational mobility across African districts
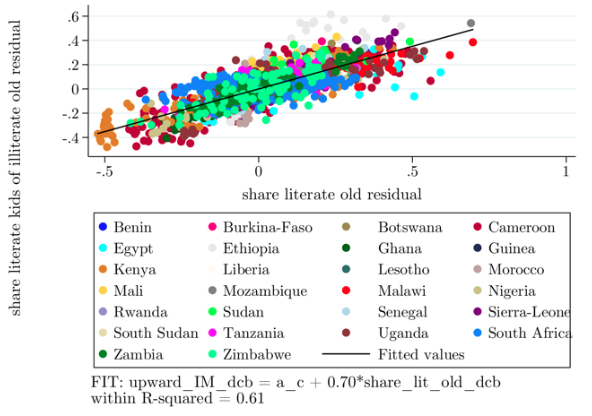
The correlation between old generation's literacy and intergenerational mobility is especially strong for rural, as compared to urban, households, a pattern that may be behind the recent rise in African urbanisation. The correlation is somewhat stronger for girls, as compared to boys, suggesting that a favourable (unfavourable) environment may be particularly beneficial (detrimental) for girls.
The geography of social mobility
We also characterise the geography of the land of opportunity in Africa. Our analysis examines the correlates of regional mobility within countries, looking at locational-ecological features, historical influences, and at-independence economic factors. While the correlational analysis does not identify causal effects, it is useful in understanding persistence.
Proximity to the coast and the capital maps into higher (lower) upward (downward) mobility, even when one conditions on the initial ‘level’ of literacy. Upward mobility is lower and downward mobility higher in malaria-prone regions, an association that works on top of the negative relationship between average education and malaria. In contrast, the correlation between educational mobility and natural resources (the presence of gold or diamond mines or oil) is weak and statistically insignificant. The analysis of historical influences reveals that proximity to colonial railroads and Christian missions, which provided education and basic health, maps into higher levels of social mobility. Pre-colonial statehood does not correlate with educational mobility (nor with mean education). At-independence development, reflected in regional population density, urbanisation, and the share of employment in manufacturing and services as opposed to agriculture, correlates strongly with educational intergenerational mobility, even conditional on the education stock.
Regional effects
The wide differences in regional intergenerational mobility may be the result of two different forces. On the one hand, regions could have a causal impact by offering better infrastructure, more schools, less violence, and more and better occupational opportunities. On the other hand, regional disparities could reflect sorting, as families with higher ability and/or higher valuation of education move to areas with better opportunities.
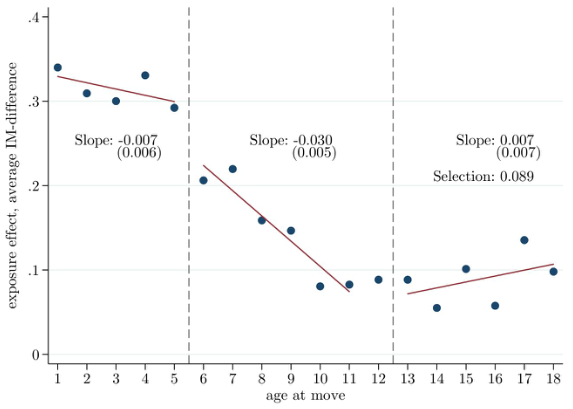
In the third part, we assess the relative magnitudes of these two forces employing an intuitive approach developed by Chetty and Hendren (2018a). This method looks solely at children of migrant families and exploits variation on the timing of moves between origin and destination districts to identify regional ‘exposure effects’. It compares educational attainment among children who moved to a better (or worse) regions in terms of average mobility at different ages to identify the rate at which their education converges to those of permanent residents. If regions have a causal effect on individual mobility, this effect should be stronger, the longer the exposure to the environment lasts.
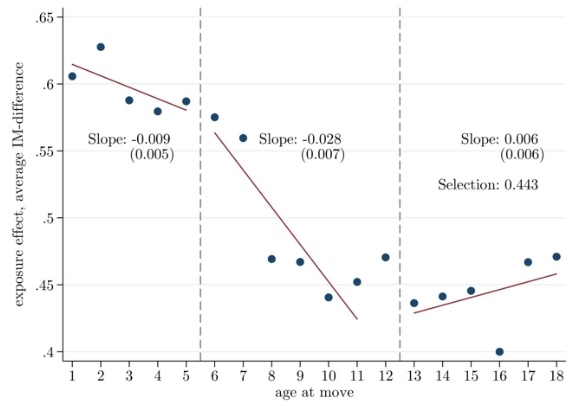
Figure 5 plots the age-specific slopes that capture the children’s exposure effect when their families move to a region with higher mobility (the latter estimated among non-movers). The figure reveals both selection effects and regional exposure effects. First, all slopes are significantly positive. Children with parents who have not completed primary schooling moving to regions with higher (lower) intergenerational mobility have better (lower) unobservable characteristics translating into a higher likelihood of completing primary school. Second, moving to a better (worse) region is associated with a higher (lower) likelihood of completing primary schooling when we look at kids moving before 12 years of age. The relationship between age of move and exposure is flat for children moving before 6. This is not surprising as primary education starts approximately at the age of 6. There is an evident declining pattern of the age-specific estimates for children moving between ages 6 and 12.
Figure 5 Regional exposure and selection effects
We also implement a variant of this approach that compares brothers and sisters who moved with their families at different ages. By exploiting within-family variation, we account for any parent characteristics that may shape their children’s education.
Figure 6 gives the age-specific exposure effects relying solely on within-family variation of children who moved at different ages (162,415 children and 65,579 multi-child households). First, the selection effect captured in the slopes after age 12 drops significantly. Second, regional exposure effects are still present. The slopes for children moving during ages one to five are around 0.35. Two siblings moving to a region with higher intergenerational mobility when they are one and four years old, respectively, have on average, the same increase in the likelihood to complete primary schooling. If the difference between destination and origin is close to one standard deviation (0.5), the increase in upward mobility is around 18 percentage points for both siblings. The age-of-move slopes decline for children moving when they are between six and 12, suggesting that when a family moves to a higher intergenerational mobility region, the six-year-old sibling benefits more than her two/three-year older sister does.
Figure 6Regional exposure effects: Within family estimates
The direction of future research
A lesson that stems from our analysis is that one needs to dig below the aggregate statistics that reveal rising education across the continent, as there are large and non-disappearing inequalities in social mobility within countries.
Our paper calls for follow-up research. A first issue that we tackle in ongoing research is mapping and understanding differences in social mobility across ethnic and religious lines, as African politics are characterised by ethno-religious favouritism and discrimination. Second, we need to move beyond correlations and understand how history and geography affect the intergenerational transmission of human capital. This is important as recent works document sizable persistence of historical episodes (see Michalopoulos and Papaioannou 2018 for an overview). Third, future work should look at the role of how policies affect the intergenerational transmission of education that differs widely within African countries and provinces.
Editor's note: This column also appeared on VoxDev.org.
References
Alesina, A, S Hohmann, S Michalopoulos and E Papaioannou (2019a), “Intergenerational mobility in Africa”, CEPR Discussion Paper 13497.
Alesina, A, S Hohmann, S Michalopoulos and E Papaioannou (2019b), “Ethnic and religious intergenerational mobility in Africa”, mimeo, London Business School.
Card, D, C Domnisoru and L Taylor (2018), “The intergenerational transmission of human capital: Evidence from the Golden Age of upward mobility”, NBER Working Paper 2500.
Chetty, R and N Hendren (2018a), “The impacts of neighbourhoods on intergenerational mobility I: Childhood exposure effects”,The Quarterly Journal of Economics 133(3): 1107-1162.


