Over the last decade, intergenerational mobility has received increasing attention in the policy and academic debate, and for good reason. Mobility indicators shed light on the extent to which individuals with different initial conditions, which are outside of their control, are presented with equal opportunities to succeed. As such, mobility is considered a proxy for a fair and fluid society.
Over this period, the empirical literature on intergenerational mobility in income has witnessed a strong revival as economists have been able to access large administrative datasets in a handful of countries (e.g. Chetty et al. 2014 in the US, Corak 2017 in Canada, Boserup et al. 2013 in Denmark, Heidrich 2017 in Sweden, Aloni 2017 in Israel). These large datasets have led to precise estimates of intergenerational mobility indexes and have opened the possibility to analyse mobility patterns, within countries, at a disaggregated geographical level. This variation has been exploited to learn about what socioeconomic factors are strongly correlated with income mobility across regions.
In a new paper (Acciari et al. 2019), we add to this recent wave of studies and introduce a new dataset that allows us to develop the first systematic investigation of intergenerational income mobility for the Italian economy. Our starting point is the administrative electronic database on individual tax returns maintained by the Italian Ministry of Economy and Finance. From this data source, we extracted a sample of two cohorts of Italians born between 1942-1963 and 1972-1983. We matched parents and children through their social security numbers. Our final dataset contains nearly 650,000 parent–child pairs with detailed income information for three years in each cohort.
We organise our study of intergenerational mobility in Italy with these new data in three parts: national statistics, differentials in mobility across Italian provinces, and a comparison of Italy and with countries.
We begin with the analysis of intergenerational mobility in Italy at the national level. We order parents according to their position in the national income distribution and then rank children in a similar way.
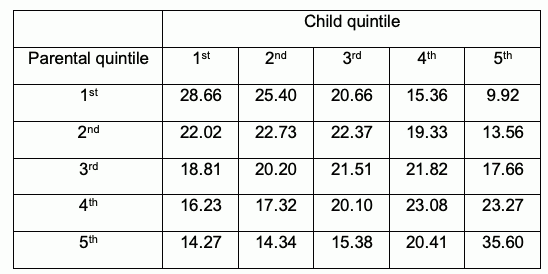
Table 1 shows the estimated national transition matrix across income quintiles. Out of 100 children whose parents are in the lowest quintile of the income distribution (earning less than €15,000), only ten of them will reach the top 20%, once adults. By contrast, for every 100 children born from top-income parents (earning above €50,000), at least 35 of them remain in the top quintile of the income distribution as adults.
Table 1 National quintile transition matrix (%)
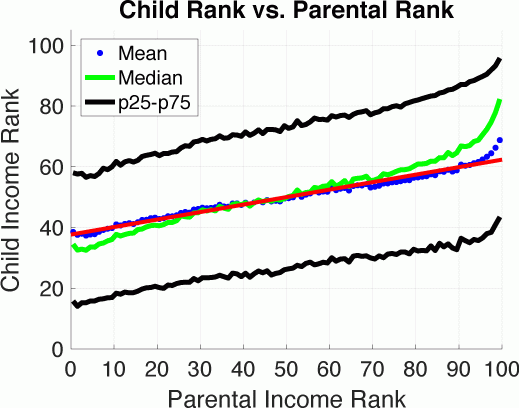
Figure 1 helps to visualise the relationship between the position of parents within the parental income distribution and that of their children within the distribution of child incomes. On the horizontal (vertical) axis, the parental (child) rank within the parental (child) income distribution is depicted, from the poorest (rank 1) to the richest (rank 100).
Figure 1 Child mean rank conditional on parental income rank
Notes: Ranks are percentiles (1-100). The blue dots represent the mean rank of children conditional on each percentile of the parental income distribution. The red and green lines are, respectively, the ordinary least squares and the median regression line. The black lines delimit the interquartile range.
The figure shows that a child born to parents with income below the median income level (thus, on average, with income in the 25th percentile of the distribution) is expected to reach the 44th percentile of her own income distribution as an adult. Children of parents ranked 90/100 in the national income distribution will, on average, reach rank 60 as adults, whereas children of parents ranked 10/100 will reach, on average, rank 40 as adults. Except at the very top, the rank-rank relation is quite linear.
Our data also suggest that upward mobility is higher for sons and first-born among siblings. Moreover, it is higher for children who, once adult, migrate to other regions within Italy. Thus, geographical mobility goes hand in hand with social mobility.
Figure 1 illustrates that there is more intergenerational income persistence when we measure children’s outcomes with their median rank instead of their mean rank. The reason is that the conditional distribution of child outcomes is very skewed: most of the mass of the conditional distribution of child income is at the bottom of the distribution for children of low-income families, whereas the mass concentrates at the top for children of top earners.
The interquartile range reveals a striking dispersion of outcomes around the median. For example, at the 10th percentile of parental income, one quarter of children have incomes above the 60th percentile, and at the 90th percentile of the parents’ distribution, one quarter of children have incomes below the 35th percentile. It follows that even though the slope of the rank-rank relation is strongly statistically significant, the regression has a very low R-squared, at around 0.06. The bulk of this conditional variability (roughly 85%) remains unexplained by observable characteristics of parents and children. Interestingly, the province where the children grew up has the largest explanatory power among observables.
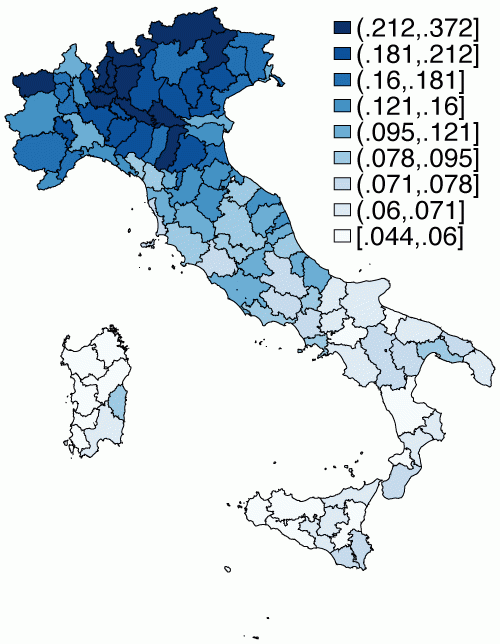
We follow up on this last finding by exploring the geographical differences in intergenerational upward mobility across the 110 Italian provinces. We document a staggering amount of variation, with a steep south-north gradient, as depicted in Figure 2. Relative to the south of Italy, provinces in the north (especially the regions in the northeast), are both more egalitarian – i.e. they display higher relative mobility – and more upward-mobile – i.e. they display higher absolute mobility. In the north, children from parents with unequal background are more similar in their economic outcomes when adults, and children from poor parents fare better when adults. The level of upward mobility in northern Italy exceeds that of Scandinavian countries.
Figure 2 Estimated transition probability from bottom to top 20% of income distribution across provinces
Note: Dark areas are more mobile.
To give a sense of the magnitudes, we can compare the province of Milan (ranked 10th in terms of upward mobility) to that of Palermo (ranked 107th), both very large provinces. The probability of moving from the bottom 20% to the top 20% of the national income distribution is 22% for children who grow up in Milan and less than 6% for those who are raised in Palermo.
Next, we investigate what socioeconomic indicators are most closely associated with upward mobility at the provincial level. We use nearly 50 indicators for productivity, labour market conditions, demographic structure, educational attainment, family instability, crime, and economic openness from ISTAT, the National Statistical Institute. In addition, we have several measures of social capital and a unique and very detailed set of indicators of school quality. Extracting a small number of principal components from each category of indicators in order to reduce the number of variables, we find that province-level mobility is strongly correlated with local labour market conditions, indicators of family instability, and two specific indexes of school quality: students’ grades and test scores, and the quality of preschool.
Finally, we ask how the level of intergenerational mobility in Italy compares to that estimated in other countries. We find that mobility in Italy is higher than in the US but lower than in the Nordic countries.
In sum, our findings contain some good news and some bad news. On the one hand, they paint a somewhat less pessimistic picture of intergenerational mobility at the national level compared to many previous studies that tend to represent Italy as a paralysed society. On the other hand, they reveal acute inequality in the degree of upward mobility within the country: the north appears to be a land of equal and abundant opportunities, and the south to be a land where ranks in society endure across generations. Improving school quality and labour market opportunities for young people could go a long way towards generating more upward mobility across generations.
Authors’ note: Any opinions and conclusions expressed in this column are those of the authors and do not necessarily reflect those of their institutions.
References
Acciari, P, A Polo and G L Violante (2019), “‘And yet it moves’: Intergenerational mobility in Italy”, NBER Working Paper 25732.
Alon, T (2017). “Intergenerational mobility in Israel”, mimeo, Tel Aviv University.
Chetty, R, N Hendren, P Kline, and E Saez (2014), “Where is the land of opportunity? The geography of intergenerational mobility in the United States”, The Quarterly Journal of Economics 129(4): 1553–1623.
Corak, M (2017), “Divided landscapes of economic opportunity: The Canadian geography of intergenerational income mobility”, University of Chicago, Human Capital and Economic Opportunity Working Paper, No. 2017-043.
Boserup, S H, W Kopczuk, and C T Kreiner (2013), “Intergenerational wealth mobility: Evidence from Danish wealth records of three generations”, discussion paper, University of Copenhagen.
Heidrich, S (2017), “Intergenerational mobility in Sweden: A regional perspective”, Journal of Population Economics 30(4): 1241–1280.


