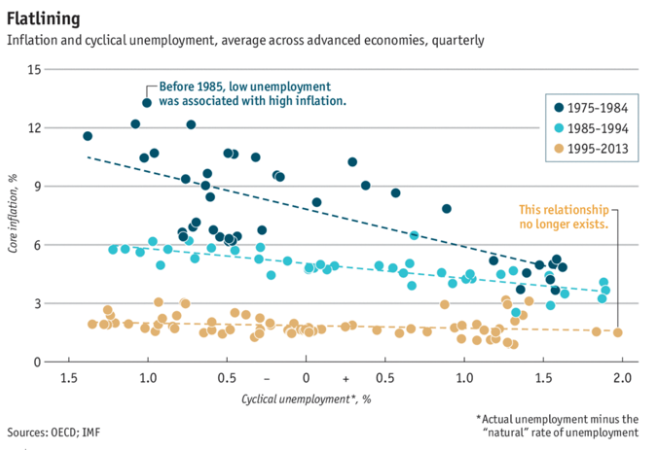
Policymakers at central banks have been puzzled by the fact that inflation is weak even though the unemployment rate is low, and the economy is operating at or close to capacity (Associated Press 2017). The Economist provided evidence of this phenomenon in 2017, reproduced in Figure 1. We contend that the puzzlement of policymakers and journalists arises from the fact that they are looking at data through the lens of the New Keynesian model in which the connection between the unemployment rate and the inflation rate is driven by the Phillips curve.
Figure 1 Inflation and unemployment in the US
In a previous paper (Farmer and Nicolò 2018), presented at the 9th Manchester Conference on Growth and Business Cycles in Theory and Practice, we provided empirical evidence indicating that the New Keynesian model is substantially outperformed by an alternative model to explain US data.1 The New Keynesian model consists of a demand equation, a policy rule and a Phillips curve. The alternative Farmer monetary model (Farmer 2012) shares the demand curve and the policy rule in common with the New Keynesian model. However, it replaces the Phillips curve with an alternative equation – the belief function (Farmer 1993) – that captures the idea that psychology, or ‘animal spirits’, drive aggregate demand.2 In Farmer and Nicolò (2018), we show that the Farmer monetary model explains better and by a large margin the co-movements in the interest rate, the unemployment rate and the inflation rate in the US.
In the international context, macroeconomic data for advanced economies show distinct cross-country differences. These differences could be potentially attributed to one of three causes. First, private sector saving rates or private sector risk aversion parameters may differ. Second, the size and sequence of the shocks that each country experienced might vary. Finally, institutions, such as central banks, could operate differently and respond to macroeconomic shocks by adopting distinct monetary policies.
In a new paper (Farmer and Nicolò 2019), we ask why the data look different across countries. We focus on three advanced economies: the US, the UK and Canada. To explain the observed differences in the macroeconomic behaviour of real GDP, the inflation rate and the yields on three-month Treasury securities, we compare the Farmer monetary model, closed with a belief function, with the New Keynesian model, closed with the New Keynesian Phillips curve.
To identify the reasons for differences in the data among the US, the UK and Canada, we estimated two alternative specifications of the Farmer monetary model and the New Keynesian model over the full sample, from 1961Q1 to 2007Q4, and over two sub-samples corresponding to the break in US monetary policy in 1979Q3.
For our first specification, we estimated unconstrained versions of the Farmer monetary and New Keynesian models in which we allowed the private sector, the conduct of monetary policy and the size of the fundamental shocks to differ across countries. For our second specification, we estimated restricted versions of each model in which we constrained the private sector equations to have common parameters across countries. We estimated both versions of the two models and we compared their marginal data densities, a statistic that provides a comparable summary of the evidence contained in the data about each model specification (Sims 2008). The higher the marginal data density, the better the model fits the data.
For both the New Keynesian and the Farmer monetary models, we found strong evidence in favour of the constrained specification in which the parameters of the private sector equations were restricted to be the same in all three countries.
Our most important finding comes from comparing the marginal data densities for three different estimation periods of the Farmer monetary model with those of the New Keynesian model. For all three data periods, the preferred specification is the Farmer monetary model which substantially outperforms the New Keynesian alternative. These results are in line with the results in Farmer and Nicolò (2018) for the US case and they provide additional evidence in support of our earlier findings.
We explain our results by appealing to a property that mathematicians call hysteresis. Conventional dynamical systems have a stable steady state that acts as an attractor. The economy will converge to that steady state, no matter where it starts. In contrast, the attractor in the Farmer monetary model is a one-dimensional continuum of inflation-unemployment equilibria. Where the economy ends up on this continuum depends on where it starts.
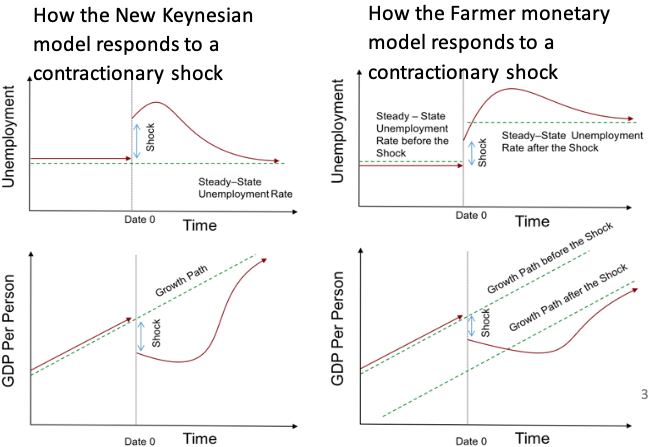
The behaviour of the New Keynesian model in response to a shock is depicted in the two left-side panels of Figure 2. Following an unanticipated contractionary shock, the upper-left panel shows that unemployment will return to its natural rate, and the lower-left panel shows that GDP per person will return to its steady state growth path.
Figure 2 The response of the New Keynesian model to a shock (left panel) and the response of the Farmer monetary model to the same shock (right panel)
Source: Farmer (2016), Chapter 8.
The Farmer monetary model does not share that property. Although the economy follows a unique path from any initial condition, the Farmer monetary model has a continuum of possible steady states and which one the economy ends up at depends on initial conditions. This is depicted in the two right-side panels of Figure 2, which show how the Farmer monetary model reacts to an unanticipated contractionary shock.
Figure 3 shows the behaviour of US GDP per person before and after the 2008 recession. This figure helps explain why the Farmer monetary model fits the data better than the New Keynesian model. The behaviour of real GDP, the inflation rate, and the interest rate are highly persistent in the data, not only for the for the US, but also for the UK and Canada. These data are better explained as co-integrated random walks than as mean-reverting processes. The Farmer monetary model captures that fact. The New Keynesian model does not.
What does it mean for two series to be co-integrated? Co-integrated series are like two drunks walking down the street, tied together with a rope. The drunks can end up anywhere, but they will never end up too far apart. The same is true of the inflation rate, the unemployment rate, and the interest rate in the US data.
Figure 3 US data before and after the 2008 recession
Source: Farmer (2016), Chapter 8.
In our view, there has been no stable Phillips curve in the data of any country since Phillips wrote his eponymous article in 1958. In Farmer and Nicolò (2019), we show how to replace the Phillips curve with the belief function, an alternative theory of the connection between unemployment and inflation that better explains the facts. That theory is explained in more depth in Farmer (2016) and in a recent research paper (Farmer and Platonov 2019). The research programme we are engaged in should be of interest to policymakers in central banks and treasuries throughout the world who are increasingly realising that the Phillips curve is broken.
References
Associated Press (2017), “A puzzle for central bankers: Solid growth but low inflation”, 27 August.
The Economist (2017), “The Phillips curve may be broken for good”, 1 November.
Farmer, R E A (1993), The macroeconomics of self-fulfilling prophecies, MIT Press.
Farmer, R E A (2012), “Animal spirits, persistent unemployment and the belief function”, In Roman Frydman, R and E S Phelps (eds), Rethinking expectations: The way forward for macroeconomics, Princeton University Press.
Farmer, R E A (2016), Prosperity for all: How to prevent financial crises, Oxford University Press.
Farmer, R E A and G Nicolò (2018), “Keynesian economics without the Phillips curve”, Journal of Economic Dynamics and Control 89: 137-50.
Farmer, R E A and G Nicolò (2019), “Some international evidence for Keynesian economics without the Phillips curve”, NBER working paper 25743.
Farmer, R E A and K Platonov (2019), “Animal spirits in a monetary model”, European Economic Review 115: 60-77.
Sims, C (2008). “Eco 513 class notes, fall 2008”.
Endnotes
[1] We thank George Bratsiosis for inviting us to present this paper at the 9th annual conference organised by the Centre of Growth and Economic Business Cycles at the University of Manchester on 5th – 6th July, 2018.
[2] The belief function is a fundamental equation with the same methodological status as preferences and technology. To operationalise the belief function, we assumed that people make forecasts of future nominal income growth based on observations of current nominal income growth. If x is the percentage growth rate of nominal GDP this year and E[x’] is the expected rate of growth of nominal GDP growth next year, we assumed that x = E[x’].


