Every four years, voters in the US vote for a president. But the voters do not elect the president, that is done by the Electoral College. Today, the Electoral College amounts to a set of mathematical rules that transform the country’s votes into a presidential winner.
As the world now knows, these rules can yield a surprising result. An inversion in the Electoral College happens when the candidate who wins the popular vote is not the candidate who wins the presidency. There have been four times when the winner of the presidency did not receive the most votes: 1876, 1888, 2000, and 2016.
Practical proposals to repeal the Electoral College system – including over a hundred constitutional amendments proposed by members of Congress over the past two centuries – are often predicated on the belief that inversions are probable enough to warrant major constitutional change (Edwards 2011, Peirce and Longley 1968). These proposals are possibly more politically viable today than ever. Elizabeth Warren, Bernie Sanders, and several other Democratic candidates for the 2020 nomination have openly called for the end of electoral voting – and therefore the end of inversions.
Just how likely are inversions?
All of this attention to electoral inversions raises a question: how likely is an inversion? Data journalists and election forecasters have applied increasingly sophisticated statistical tools to analysing politics. They predict results of particular elections, such as Trump versus Clinton in 2016 in the weeks before voters’ ballots are cast. Just before the 2016 election, for example, fivethirtyeight.com predicted an 11% chance of an inversion (Silver 2016).
But what has been unclear until now is how often we should expect these electoral inversions. Was it a fluke that the Electoral College generated four inversions in the last two centuries? Could there have been even more? Are inversions baked into the Electoral College system, or do they depend on the particular candidates or parties?
The same types of election models used to forecast presidential races can be cast backwards over the centuries
In new work (Geruso et al. 2019) we study three eras of US politics from the 19th, 20th, and 21st centuries, from contests between Whigs and Democrats before the Civil War to today’s Republicans and Democrats.
We specify election models aimed at generating probability distributions over national elections in various historical periods. We estimate the models using state-level voting data in presidential races extending back to 1836. Sampling from the estimated model yields probable outcomes for each state’s vote tally. Aggregating across the states yields a probable national election outcome in terms of citizen votes and Electoral College ballots. Using this process, we generate many simulated elections to produce a joint probability distribution over the national popular vote and the national Electoral College outcome.
Our statistical model is flexible enough to nest the standard approaches to election modelling from the positive political science literature (Gelman and King 1994, and Katz et al. 2004), recent advances in election forecasting (Silver, 2016), as well as other non-parametric approaches. As a result, we can show that our main conclusions hold no matter what statistical model you think best explains voting patterns in presidential elections.
Electoral College inversions have been very likely since the 1800s…
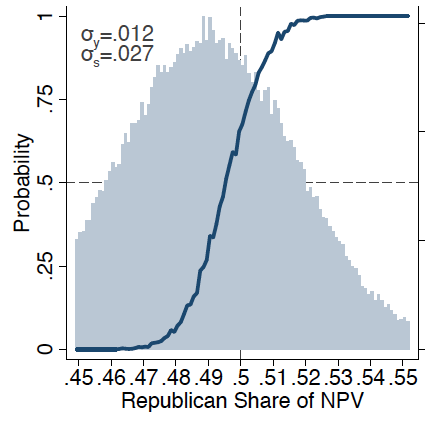
Figure 1a Modern: Electoral College victory probability
Figure 1b Modern: Inversion probability
We calculate the probability of an inversion for each potential national popular vote outcome, tracing a function that describes these probabilities. In other words, we ask what the probability of an inversion is if the Republican wins the popular vote by 2 percentage points, or by 1 percentage point, or if he or she loses by 3 points or any other number. Figure 1 plots these probabilities. Unsurprisingly, the curve slopes upwards, which means that Republicans are more likely to win the presidency when they receive more votes. But there is nothing special about winning a majority of the votes – there is no jump in probabilities at 50%. Instead, either party is likely to win an inversion in a close election.
Our analysis shows that inversions are surprisingly likely, especially in close elections. The popular vote winner will lose 32% of elections decided by 2 percentage points or less (1.3 million votes by the 2016 turnout). This jumps to 45% of elections decided by 1 percentage point or less (about 2.6 million votes by the 2016 turnout). Interestingly, this is a long-run property, not a modern phenomenon. We show that Electoral College inversions have been very likely ex ante in close elections since the 1800s.
… and we don’t need to agree on the perfect model of presidential elections to accept this finding
Because such simulations are in principle sensitive to modelling choices, we repeat the process many times under alternative assumptions about how common factors affect voting outcomes across states. For example, how important are region-specific shocks? And shocks linking states with similar racial compositions?
Figure 2b Probability of Republican Electoral College win at each NPV, across 92 models
Rather than preferring a particular set of assumptions, we examine the envelope of results described by any plausible model. Figure 2 plots results from 92 different statistical models of elections. These models differ substantially in their implied probability distributions over the national popular vote and in how correlated state outcomes are within an election. The latter determines, for example, the degree to which Florida and Ohio tend to move together in an election year.
The high rate of electoral inversions in close elections holds under any plausible model of how state elections unfold. Thus, searching over a broad class of models generate an informative lower bound on inversion probabilities in close elections.
In other words, we do not need to agree on the perfect election model to know that a high probability of a mismatch between the popular vote winner and the Electoral College winner has been a constant feature of presidential politics throughout US history. Any plausible model tells us so.
There’s no reason to expect the electoral college to be symmetric
In principle, it could be the case that inversions are likely but are symmetric in the sense of being equally likely to be awarded to Republicans as Democrats. But that does not turn out to be true of contemporary presidential politics. Over the last 30 years, the probability has been about 70% that if an inversion occurs, it would have been a Democratic popular vote majority and a Republican Electoral College win.
To better understand how the Electoral College generates inversions and the sources of asymmetry, we simulated outcomes under alternative aggregation rules. One set of simulations eliminated the two elector ballots that each state receives for its Senators. That counterfactual confirmed that given observed voting patterns, the two votes per Senator – which distorts the population-to-Electoral College representation ratio – gives modern Republicans an advantage relative to Democrats with respect to mismatches between the Electoral College outcome and the popular vote.
Nonetheless, and although it has not yet happened (except arguably in the case of Kennedy in 1960), there is still a significant possibility that a Democrat will win the Electoral College in a future race in which a Republican wins the popular vote by a narrow margin. And the two votes for Senators does not increase the probability of an inversion – it merely changes which party wins the inversions.
Almost all life-long voters will eventually experience an inversion
Average Americans will vote in 60 years’ worth of elections over their lifetimes. How likely is it that at least one of these will be an inversion? If elections continue to be as close as they have been in the last 30 years, the lifetime probability of voting in an inversion is at least 80%. Even if the probability of an inversion is only modest in one election, those probabilities accumulate after years of voting in close races. Voting in an election where the winner loses the popular vote is a fact of political life for American voters.
Changing US demographics will not affect this
Strikingly, we find that inversions were about as likely in a close election between 19th century Whigs and Democrats as they are in a modern election – even as almost everything else about presidential politics has evolved. Despite the fact that the rules of presidential elections have changed throughout the history of the presidency, including enfranchising women, non-whites, and others, and even as new parties and new states have emerged, inversions have endured as a fact of presidential politics and a likely outcome of close elections.
This is because inversions are fundamental to the random, statistical nature of the Electoral College. We can expect inversions to continue to be likely in close elections in 2020 and beyond. We do not know exactly how US politics will change – maybe the set of parties will change once again or the geographic alignment of parties to states will shift. But as long as the Electoral College continues to statistically separate its winner from the winner of the popular vote, inversions will remain likely in close elections.
References
Silver, N (2016), “A User’s Guide To FiveThirtyEight’s 2016 General Election Forecast”, FiveThirtyEight.com.
Edwards, G C (2011), Why the Electoral College is bad for America, Yale University Press.
Peirce, N R, and L D Longley (1968), The people’s President: the electoral college in American history and the direct-vote alternative, Simon and Schuster.
Gelman, A, and G King (1994), “A Unified Method of Evaluating Electoral Systems and Redistricting Plans”, American Journal of Political Science 38(2): 514–554.
Katz, J N, A Gelman, and G King (2004), “Empirically evaluating the electoral college”, in J Krosnick et al. (eds), Rethinking the Vote: The Politics and Prospects of American Election Reform, Oxford University Press.


