"… there is still a bit of a puzzle in that we’re hearing about labour shortages now all over the country in many, many different occupations in different geographies. … I would have expected, that wages would move up a little bit more."
Jerome Powell, chairman of the Federal Reserve Board in the United States.
Jerome Powell’s puzzle has also been prominent in many other advanced economies, Sweden included (Sveriges Riksbank 2017). For example, in its flagship report released in December of 2018, the Swedish central bank estimated that the output gap in Sweden had been positive for three consecutive years. Over those same years, nominal wage growth had not budged and remained stable at around 2.5%.
Although estimates of unobserved variables such as ‘potentials’ or ‘natural rates’ are uncertain in real time (Orphanides and van Norden 2002), survey-based indicators pointed to continuously improving labour market conditions during the recovery from the Great Recession. This gave policymakers confidence in their assessment of high resource utilisation, tight labour markets, and an impending increase in inflation. But as I show in this column based on my recent paper (Frohm 2020), qualitative indicators can also give a biased picture of real-time labour market conditions. This was particularly the case in the period after the Great Recession.
An establishment-level measure of labour shortages
With establishment-level data from the Swedish Public Employment Service’s interview survey (Arbetsförmedlingens intervjuundersökning, or AFU), which is a large representative business survey, I construct a quantitative measure of labour shortages. The surveys asks respondents (1) if they perceived labour shortages in connection to recruitment over the past six months, and if so (2) how many positions they experienced shortages in. The measure of labour shortages is computed as the ratio of number of labour shortages to total employment at the establishment. This measure of relative labour shortages is continuous and relative: a higher value reflects increasing labour shortages relative to employment at establishment level, as is typically expected during a period of labour-market tightening. Similarly, a lower value means that establishments are experiencing fewer labour shortages and indicate a looser labour market.
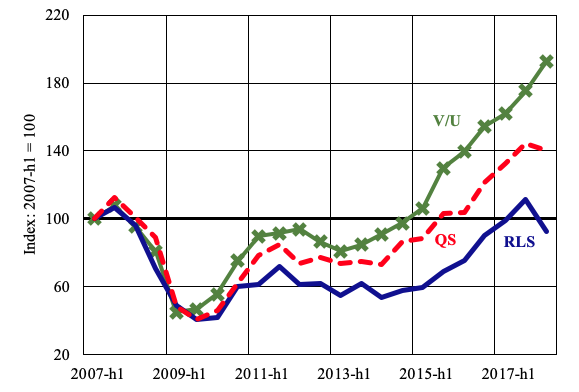
Figure 1 shows relative labour shortages compared to the purely qualitative indicator of labour shortages computed from the same survey, which is the ratio of respondents experiencing labour shortages to the total number of responses alongside the conventional (quantitative) vacancy-to-unemployment ratio, indexed to 100 in 2007h1. From the beginning of 2011 and onward, relative labour shortages developed markedly weaker than both qualitative shortages and the vacancy-to-unemployment ratio. Moreover, and contrary to the other indicators, relative labour shortages only exceeded their pre-crisis level in the second half of 2017, before falling back in the first half of 2018. By contrast, both the qualitative shortages and vacancy-to-unemployment ratio indicators regained their pre-crisis levels back in 2015 and have been suggestive of stronger labour market conditions throughout the post-crisis period than relative labour shortages.
The reason why relative labour shortages indicate more labour market slack than the other survey-based measure is that they provide information on the supply and demand of labour from a recruiting firm’s perspective, rather than providing merely the direction of labour market tightness in case of the qualitative indicator (i.e. the proportion of respondents experiencing labour shortages). The fact that the measures diverge tells us that an increasing number of respondents were perceiving labour shortages during the recovery, but that their quantitative assessment of labour shortages was decreasing.
Figure 1 Relative labour shortages (RLS) and other indicators
Source: Frohm (2020) and National Institute of Economic Research (NIER).
Notes: Index: 2007h1 = 100. QS (the dashed line) is simply the share of respondents that responded "Yes" to whether or not they experienced labour shortages in connection to recruitment over the past six months. V/U (the crossed line) is the vacancy-unemployment ratio measured as total number of vacancies as percent of the labour force, over unemployed persons as percent of the labour force in the age group 15-74 years retrieved from the Swedish National Institute of Economic Research. RLS (the solid line) is the average ratio of number of positions where respondents experienced labour shortages to total employment at the establishment.
Signs of a non-linear relationship between labour shortages and wage growth
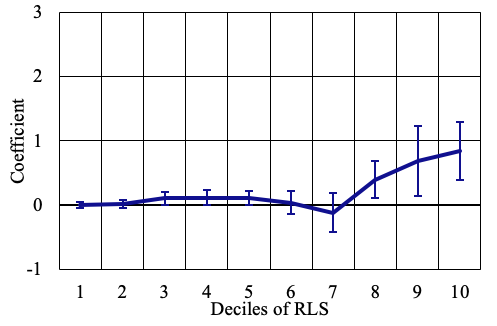
As the AFU survey also collects respondents’ assessments of their current average annual nominal wage growth, I show that relative labour shortages are correlated with wage growth at the establishment level. With establishment, sector-time (controlling for, for example, sector-level productivity or negotiated wages) and region-time fixed effects (controlling for regional labour market conditions) for a sub-sample of establishments that have participated in more than three-quarters of all survey waves (around 6,000 establishments), there is evidence of wages responding non-linearly to relative labour shortages (see Figure 2). Wage growth is estimated to be about 0.8 percentage points higher for establishments with relative labour shortages in the 10th decile than if relative labour shortages = 0. Moreover, the relationship appears to materialise only when relative labour shortages are at higher levels.
These results hold irrespective if unweighted estimates are used (panel A) or those with sample weights (panel B). In a nutshell, this new evidence suggest that labour markets in Sweden would have to tighten considerably more to increase wage growth, in line with the theoretical analyses of Daly and Hobjin (2014) and Lindé and Trabandt (2019), as well as aggregate empirical analyses by Byrne and Zekaite (2018) and Nickel et al. (2019) for the euro area.
Figure 2 Estimated impact of deciles of relative labour shortages on nominal annual wage growth
(A) Unweighted estimates
(B) With sample weights
Source: Frohm (2020).
Some caution in the use of qualitative survey indicators
Policymakers often use qualitative surveys as cross-checks for estimates of unobserved variables, like the output gap or unemployment gap. However, the evidence in this column suggests that while surveys reporting simply qualitative indicators (or labour market indicators reflecting changes in the numbers of unemployed, rather than those employed) may reasonably capture turning points, they may provide misleading signals as to the degree of labour market tightness – particularly in the aftermath of severe downturns.
This analysis is highly policy relevant. Several members of the Executive Board of the Swedish central bank highlighted record-level labour shortages as part of their assessment of the economic conditions at the December 2018 Monetary Policy Meeting, when the decision to begin tightening monetary policy was taken (Sveriges Riksbank 2018b). As my analysis shows, qualitative surveys of labour shortages likely underestimated the true degree of labour market slack in the recovery from the Great Recession and thus provided an overly strong signal for wage growth and inflation.
In the aftermath of the current Covid-19 crisis, there is a risk that respondents’ reference levels change again. By how much, and in what direction will likely be determined by the timing, length, and strength of the ensuing recovery.
Authors note: The opinions expressed in this column are the sole responsibility of the author and should not be interpreted as reflecting the views of Sveriges Riksbank. I am very grateful to Valerie Jarvis for thoughtful comments and suggestions.
References
Byrne, D and Z Zekaite (2018), “Missing wage growth in the euro area: is the wage Philips curve non-linear?”, Central Bank of Ireland Economic Letters 9.
Daly, M C and B Hobijn (2014), “Downward nominal wage rigidities bend the Phillips curve”, Journal of Money, Credit and Banking 46(S2): 51–93.
ECB (2015), “A survey-based measure of slack for the euro area”, Box 6 in ECB Economic Bulletin 6/2015.
Frohm, E (2020), “Labor shortages and wage growth”, Sveriges Riksbank Working Paper 394.
Gayer, C and B Marc (2018), “A ‘New Modesty’? Level Shifts in Survey Data and the Decreasing Trend of ‘Normal’ Growth”, European Commission Discussion Paper 083.
Lindé, J and M Trabandt (2019), “Resolving the missing deflation puzzle”, VoxEU.org, 12 November.
National Institute of Economic Research (2018a), “Har sambandet mellan Barometerindikatorn och BNP-tillväxt ändrats över tid?” (“Has the correlation between the Economic Tendency Survey and GDP growth changed over time?”), Economic Tendency Survey, June, pp. 14–17.
National Institute of Economic Research (2018b), Swedish Economy Report, June.
Nickel, C, E Bobeica, G Koester, E Lis, and M Porqueddu (2019), “Beyond the Phillips curve: Understanding low wage growth in the euro area”, VoxEU.org, 25 November.
Nyman, C (2010), “An indicator of resource utilisation”, Sveriges Riksbank Economic Commentaries 4.
Orphanides, A and S van Norden (2002), “The unreliability of output gap estimates in real time”, Review of Economics and Statistics 84(4): 569–583.
Sveriges Riksbank (2017), Monetary Policy Report, July.
Sveriges Riksbank (2018a), Monetary Policy Report, December.
Sveriges Riksbank (2018b), “Monetary Policy Minutes”, December.
Tito, M D (2018), "Help Wanted: Evaluating Labor Shortages in Manufacturing", FEDS Notes, March 9.
Endnotes
1 Interview by Kai Ryssdal for Marketplace, 12 July 2018 (https://www.marketplace.org/2018/07/12/economy/powell-transcript/).
2 Figures from Sveriges Riksbank Monetary Policy Report in December (Sveriges Riksbank 2018a). The assessment was also held by other macroeconomic forecasters such as the National Institute of Economic Research (see their Swedish Economy Report in December 2018).
3 Also wage drift, that is the deviation of actual wages to negotiated wages, remained low and stable during the period.
4 Indicators based on surveys are commonly used to assess resource utilisation or labour market slack. See Nyman (2010) for Sweden, ECB (2015) for the euro area and Tito (2018) for the US.
5 The AFU survey is unique in many ways. The sheer size of the sample and high response rate (often above 80%) yields a number of responses of around 10,000 per survey wave.
6 That qualitative surveys can represent different quantities over time has also been highlighted by Gayer and Marc (2018) and National Institute of Economic Research (2018) in other contexts. These studies show that the “normal” level of the DG-ECFIN Economic Tendency Survey of 100 is consistent with lower GDP growth over time. This has been rationalized with the ”New Modesty”, which refers to a psychological or cognitive effect: that respondents’ answers to qualitative survey questions are relative to a ‘normal’ benchmark. After a severe recession for example, respondents may have lowered their underlying reference standard to a lower level of economic activity or labour shortages. RLS on the other hand uses quantitative information on labour shortages to mitigate such biases.
7 The positive relationship is robust also to establishment-level controls such as expected employment in the next 24 months or demand conditions in the next 6-12 months. Here, deciles are computed for the whole sample period.
8 Here, deciles of relative labour shortages are computed for all positive values of relative labour shortages, and relative labour shortages = 0 is used as the omitted group. This means that all results are compared to if a respondent does not experience any labour shortages.
9 Although the analysis presented here cannot readily be replicated for other jurisdictions, due to the specifics of the survey data, it is unlikely that Swedish respondents behave very differently from those in other advanced economies when answering qualitative surveys. If this was the case, it would not be possible to compare results from for example the DG-ECFIN Economic Tendency Survey or the Purchasing Manager Indices (PMIs) across countries.


