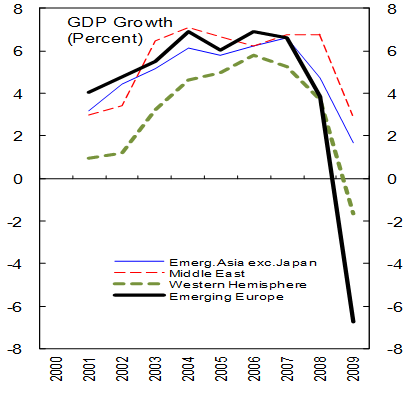
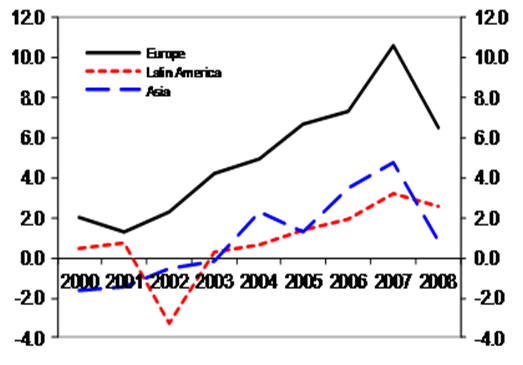
Capital inflows were larger in emerging Europe and fell more severely during the crisis than in other emerging economies (IMF 2010). Prior to the crisis, cross-border loans from Western European parent banks to their emerging European affiliates accounted for most of the difference (Figure 1). The large inflows created macroeconomic and financial sector vulnerabilities – larger current account deficits, rapid credit growth, worse fiscal positions, and heavier indebtedness (often in foreign currencies) of households in a large part of the region. These vulnerabilities, as well as the susceptibility of externally funded credit growth to the financing difficulties of parent banks when the crisis struck, are reasons why emerging Europe went through a deeper downturn than other emerging economies (Figure 2). Still, the worst was avoided through the European Bank Coordination Initiative which prevented a stampede for the exit when individual incentives to withdraw funds were at their peak (see Andersen 2009).
Figure 1. The recession is strongest in emerging Europe
Source: IMF, World Economic Outlook, and IMF staff calculations.
Figure 2. Emerging economies: Overseas borrowing by banks and corporates (% of GDP)
Sources: IMF, International Financial Statistics, and IMF staff calculations. Note: Other investment liabilities (loans, and currency and deposits of banks, and loans of nonblank private sector), net.
Are capital inflows back?
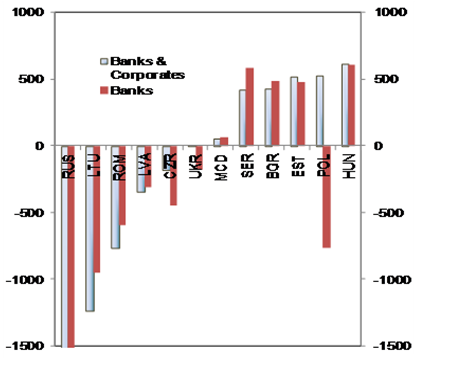
The latest data (2009Q4) shows that cross-border loans into banks and corporates, continue to fall in many countries across the region (Figure 3) even as foreign direct investment equity inflows continue to hold up. Bank inflows have been an important source of funding for many countries in the region in the past. With lacklustre foreign borrowing by banks, private sector credit growth is still negative in some emerging EU member states and Ukraine (Figure 4). Gross bond issuances, however, have picked up in 2010, but these are mostly sovereign issuances, and the share of emerging Europe in 2010 (until March) in total bond issuances in the emerging economies has fallen from the 2008 level.
Figure 3. A mixed picture: Cross-border loans in banks and corporate 2009Q4 (€ millions)
Sources: IMF, International Financial Statistics, various central bank websites, and IMF staff calculations. Note: Other investment liabilities of banks and corporates, net. RUS: -4005 (banks and corporates), -6004 (banks).
Figure 4. Private sector credit (% change over last three months)
Sources: IMF, International Financial Statistics, and IMF staff calculations.
What motivated the inflows before the crisis?
Emerging Europe is the only region in which capital flowed “downhill” from richer European neighbours and helped this region to “converge” in income towards the richer nations (Abiad et al. 2009). Taking a detailed look at the determinants of each type of inflow, we find that a large part of the inflows before the crisis were motivated by prospects for higher returns in emerging Europe than in home markets and were related to the level of income in recipient countries (see IMF 2010). Foreign direct investment inflows were attracted by strong economic growth and urbanisation but tended to slow as the country became richer. Cross-border loans to banks and corporates, on the other hand, accelerated as the economies matured, and was attracted by growing service sectors. As the economies liberalised with institutional and structural reforms, they attracted even more inflows. When the crisis took hold, this income-convergence process came to an abrupt halt in some countries.
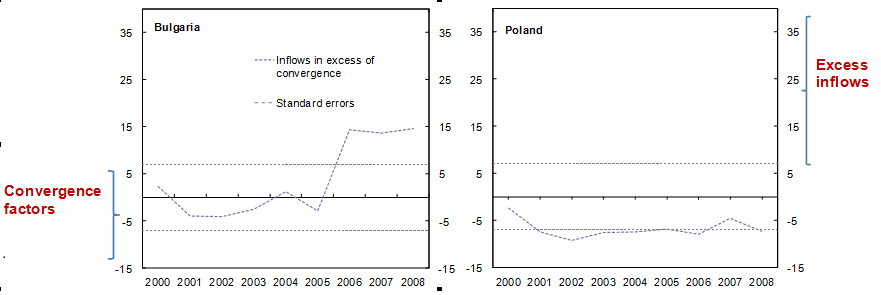
Some countries saw inflows surging in excess of what can be explained by convergence factors – such as growing income and service sectors, urbanisation, and reforms (Figure 5 and Table 1 in Appendix). Much of the exuberance was related to macroeconomic policies, exacerbated by excessive risk taking in the financial sector. Stable exchange rates, in general, and slower nominal appreciation in non-pegged exchange-rate regimes, in particular, invited more capital inflows. Countries with heavily managed or pegged exchange rates had the most rapid credit growth and received the largest volume of inflows. Improved government balances deterred inflows in pegged exchange-rate regimes but were associated with larger inflows in other countries; where the improving government balances happened along with credit booms, bank-related inflows were the strongest. An expanding non-tradables sector and appreciating real exchange rates attracted even larger inflows. Thus, the higher domestic demand, credit growth, and capital inflows reinforced one another (Figure 6).
Figure 5. Some countries received inflows in excess of convergence (total inflows as % of GDP)
Sources: IMF staff calculations. Note: The residuals are derived from a regression of overall inflows on convergence-related factors – growth in real per capita income, urbanization, size of the service sector, progress on reforms, and privatisation revenue (table 1). An excess is defined by capital inflows above the upper standard error band.
Figure 6. Higher domestic demand brought in more inflows
Sources: IMF, Balance of payments statistics, and IMF staff calculations. Note: Average for 2000-07 for EU members, 2004-07 for non-EU members.
The impact of the macroeconomic policies on capital inflows was amplified by the persistently low country risk premia on interest rates. Investors seemed oblivious to the vulnerabilities in individual countries until the crisis hit (IMF 2009). As a result, banks could borrow money overseas at very low interest rates. High profitability – due to low cost of funds and low provisioning for loan-losses during the boom – and capitalisation provided comfortable indicators of stability, reinforcing the sense that risks were manageable.
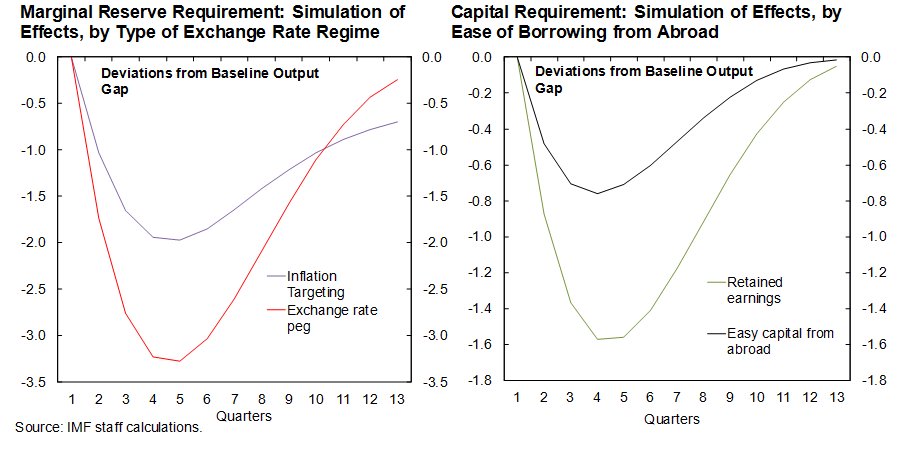
Prudential policies sought to influence the volume and composition of inflows as rising macroeconomic and financial sector vulnerabilities began to worry policymakers. While country experiences varied, prudential tools seem to have been effective in temporarily slowing capital inflows into banks and changing the composition of inflows. In general, the impact of a specific type of prudential tool depends on the monetary and exchange-rate regime and the form of cross-border liabilities of the banks (Benes et al., forthcoming, IMF 2010). Our model simulations show that prudential tools requiring higher capitalisation for risky foreign liabilities (for example “contingent capital”), have a less pronounced negative effect on output compared with tax-type tools such as marginal reserve requirements on foreign funds. They also encourage banks to restructure towards domestic funding sources and prevent liquidity crises from becoming solvency concerns (Figure 7). Moreover, the real effects of the former are less sensitive to the exchange-rate regime than marginal reserve requirements.
Figure 7.
Managing capital inflows remains a challenge
Even though the impact of the crisis differed across countries, managing capital inflows remains a challenge throughout the region. The key questions facing policy makers are: how to ensure a healthy level of foreign investment into emerging Europe, how to prevent excessive capital inflows, and how to improve the stability of an increasingly internationally integrated financial sector. The answer suggested by our analysis is that it will require a comprehensive policy response and recommendations should be tailored to country-specific circumstances. In particular:
- For countries that are already seeing a resumption of inflows, responsive macroeconomic policies will be key to stemming an excessive surge. For countries with pegged exchange rates, the best response to inflows in excess of those driven by structural factors is to tighten fiscal policies. For countries without pegged exchange rates, the most effective response could be to let the currency appreciate. A freely floating exchange rate is also helpful to prevent excessive inflows and a build-up of financial fragilities.
- These macroeconomic policies should be accompanied by improvements in the stability of the increasingly integrated financial system in the region. Prudential tools such as capital requirements on foreign borrowing help to lower excessive inflows and related risks in banks. Higher risk weights on loans to certain sectors help build buffers in the banking system and prevent overheating of certain sectors. To sustain the resilience of the financial system, these tools need supportive macroeconomic policies and effective cross-border financial supervision. Capital controls are an option if surging inflows are temporarily causing competitiveness problems (Ostry and others 2010).
- Where capital inflows conducive to income convergence have yet to resume, policymakers will need to re-orient the sources of economic growth towards the tradable sector. While this transformation will take place in the private sector, support by policies to restore a balance between the non-tradable and tradable sectors will improve inter-sectoral labour mobility, lowering skill-mismatches. Addressing country-specific growth bottlenecks in infrastructure will be crucial.
Disclaimer: The views expressed in this column are the authors’ and do not necessarily represent those of the IMF.
References
Abiad, Abdul, Daniel Leigh and Ashoka Mody (2009), “Financial Integration, Capital Mobility, and Income Convergence”, Economic Policy, 24, April.
Andersen, Camilla (2009), “Agreement with Banks Limits Crisis in Emerging Europe”, IMF Survey online
Benes, Jaromir, Johan Mathisen, and Srobona Mitra (forthcoming), “Modeling Macroprudential Policies in Emerging Economies,” IMF Working Paper International Monetary Fund (IMF), 2010, Regional Economic Outlook: Europe, May.
International Monetary Fund (IMF), 2009, Regional Economic Outlook: Europe, May.
International Monetary Fund (IMF), 2010, Regional Economic Outlook: Europe, May.
Ostry, Jonathan D, Atish R Ghosh, Karl Habermeier, Marcos Chamon, Mahvash S Qureshi, and Dennis BS Reinhardt (2010), “Capital Inflows: The Role of Controls”, IMF Staff Position Note 10/04.
|
Appendix
Table 1. Capital inflows panel regression
|
|
Dependent variable: Capital inflows in percent of GDP
|
|
Explanatory Variables
|
All inflows
|
FDI
|
Other inflows
|
Portfolio debt
|
Portfolio equity
|
|
|
|
|
|
|
|
|
|
|
|
|
|
|
|
|
Structural factors
|
|
|
|
|
|
|
|
|
|
|
|
|
|
|
GDP per capita growth (lagged)
|
|
-
|
|
|
-
|
*
|
|
+
|
|
-
|
|
+
|
**
|
|
GDP per capita growth, squared (lagged)
|
|
+
|
|
|
+
|
|
|
-
|
|
+
|
|
-
|
**
|
|
Service sector as share of GDP (lagged)
|
|
+
|
**
|
|
+
|
|
|
+
|
|
+
|
**
|
+
|
|
|
Urbanisation (lagged)
|
|
+
|
**
|
|
+
|
***
|
|
+
|
|
-
|
|
+
|
|
|
Progress on combined reform index
|
|
+
|
*
|
|
+
|
*
|
|
+
|
|
-
|
**
|
-
|
|
|
Change in privatisation revenue
|
|
+
|
|
|
+
|
*
|
|
+
|
|
-
|
|
+
|
|
|
|
|
|
|
|
|
|
|
|
|
|
|
|
|
|
Policy variables
|
|
|
|
|
|
|
|
|
|
|
|
|
|
|
Appreciation of the nominal exchange rate 1/
|
|
-
|
*
|
|
-
|
|
|
-
|
*
|
+
|
*
|
+
|
|
|
Appreciation of the nominal exchange rate 1/ (pegged regimes)
|
|
+
|
*
|
|
-
|
|
|
+
|
*
|
+
|
*
|
-
|
|
|
Appreciation of the real effective exchange rate
|
|
+
|
|
|
+
|
**
|
|
+
|
|
-
|
|
-
|
|
|
Government balance as share of GDP (pegged regimes)1/
|
|
-
|
**
|
|
+
|
|
|
-
|
**
|
-
|
**
|
+
|
|
|
Government balance as share of GDP 1/
|
|
+
|
**
|
|
+
|
|
|
+
|
**
|
-
|
**
|
+
|
|
|
Government balance/GDP* Change in credit/GDP 1/
|
|
+
|
**
|
|
-
|
|
|
+
|
**
|
-
|
**
|
-
|
|
|
Change in credit as share of GDP
|
|
+
|
*
|
|
-
|
|
|
+
|
**
|
-
|
**
|
+
|
|
|
Increase in lending rates
|
|
+
|
|
|
-
|
|
|
+
|
|
-
|
|
-
|
|
|
Change in standard deviation in NEER
|
|
-
|
|
|
+
|
|
|
-
|
|
-
|
|
-
|
|
|
Change in capital control index on inflows (lagged)
|
|
+
|
|
|
+
|
|
|
+
|
|
-
|
*
|
-
|
|
|
Change in capital control index on outflows (lagged)
|
|
-
|
|
|
+
|
|
|
+
|
|
+
|
|
-
|
|
|
|
|
|
|
|
|
|
|
|
|
|
|
|
|
|
Number of observations
|
|
65
|
|
65
|
|
74
|
74
|
74
|
|
Number of countries
|
|
12
|
|
12
|
|
12
|
12
|
12
|
|
Adjusted R^2
|
|
0.78
|
|
0.56
|
|
0.72
|
0.72
|
0.19
|
Note: Levels of significance are indicated by asterisks: *** 1 percent, ** 5 percent, * 10 percent. Wald tests show that the coefficients for overall inflows, other inflows, and debt portfolio inflows are jointly significant.
