The slope of the US yield curve, as measured by the spread between 10-year and 2-year rates, currently resides at its steepest level since 2016. The recent steepening is the result of a combination of the Federal Open Market Committee’s (FOMC) commitment to keep front-end rates lower for longer together with upward pressure on the long end due to a brighter economic outlook. The latter is driven by several factors, including the rollout of vaccination programmes, the substantial fiscal accommodation, and the expectation that the Fed will not immediately lean against the cycle by tightening its monetary policy stance.1 From these factors, fiscal accommodation played a pivotal role as the steepening intensified after the Georgia run-off for Senate seats surprisingly led to a Democrat-controlled Congress.
The short end of the curve: Anchoring of rate expectations
The anchoring of the short end of the curve at low levels suggests that the Fed’s forward guidance is well understood by the market. During the COVID-19 crisis, the Fed lowered its policy rate by 150 basis points to a target range of 0-0.25%. Since then, the FOMC’s commitment to keep rates near zero at least through 2023, motivated by the more inclusive definition of the employment mandate2 and the adoption of the average inflation targeting (AIT) framework in August 2020, strengthened the expectation that policy rates would be lower for longer. In fact, AIT is widely perceived as a commitment to tolerate an inflation overshoot (Eggertsson et al. 2020).
Survey data also indicate that market participants expect the Fed to accept an inflation overshoot before hiking rates. In particular, the number of investors that expect lift-off to occur at higher inflation realisations increased significantly. Most participants in the Fed’s September and December surveys expected the 12-month headline PCE-inflation to reach 2.3% before hiking rates; in the July survey, this was at a 2% inflation level. As a result, the median expected lift-off date in the December survey (relative to June) has been pushed further into the future, from the second half of 2023 to the first half of 2024. The postponement of a first rate hike, combined with respondents expecting higher inflation realisations at the time of a first hike, shows that the central tenet of the Fed’s new reaction function is well understood.
More recently, traders have pulled forward expectations of a first hike, primarily due to the anticipated effects of fiscal accommodation. Current market pricing indicates that lift-off occurs in the first half of 2023 as opposed to the late 2024 lift-off indicated in August 2020 (Figure 1). This is striking to the extent that market expectations do not align any longer with the latest dot plot, which suggests no hike through 2023.3
Figure 1 Market expectations for the future rate path of the Fed
Source: DNB and Bloomberg.
Note: market pricing is based on the USD OIS forward curves. Last observation 25-02-2021.
The long end of the curve: Inflation expectations rise due to fiscal accommodation
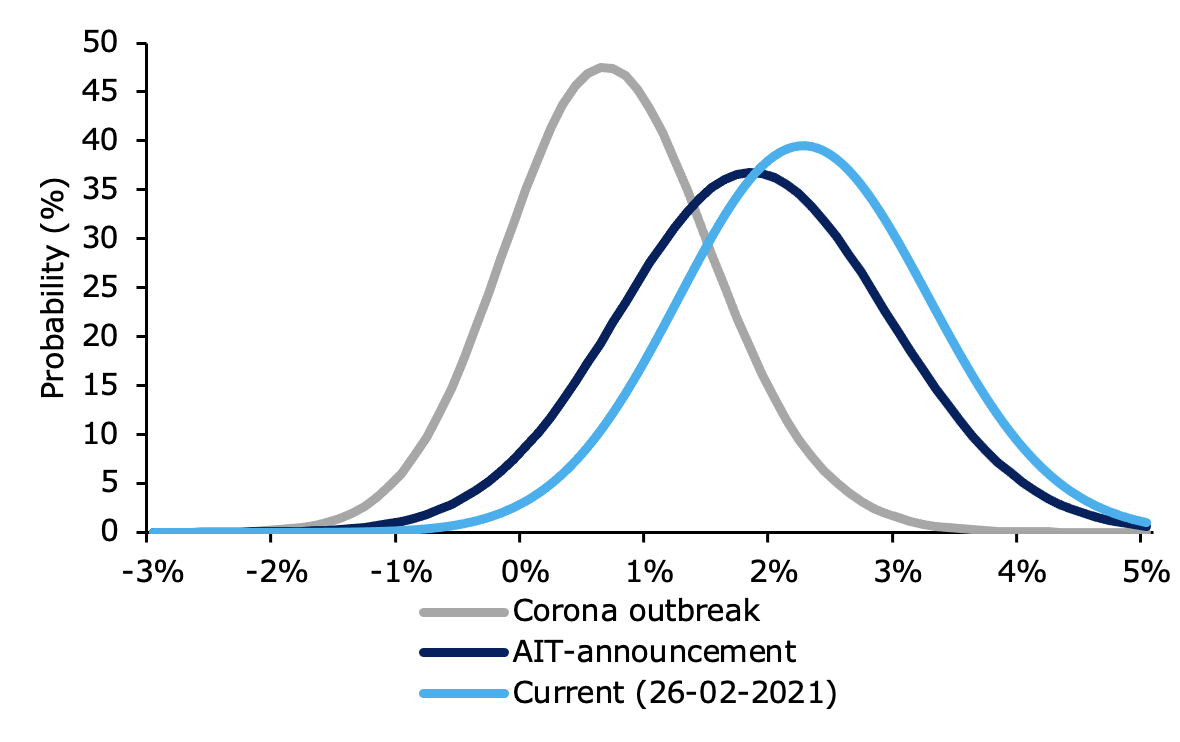
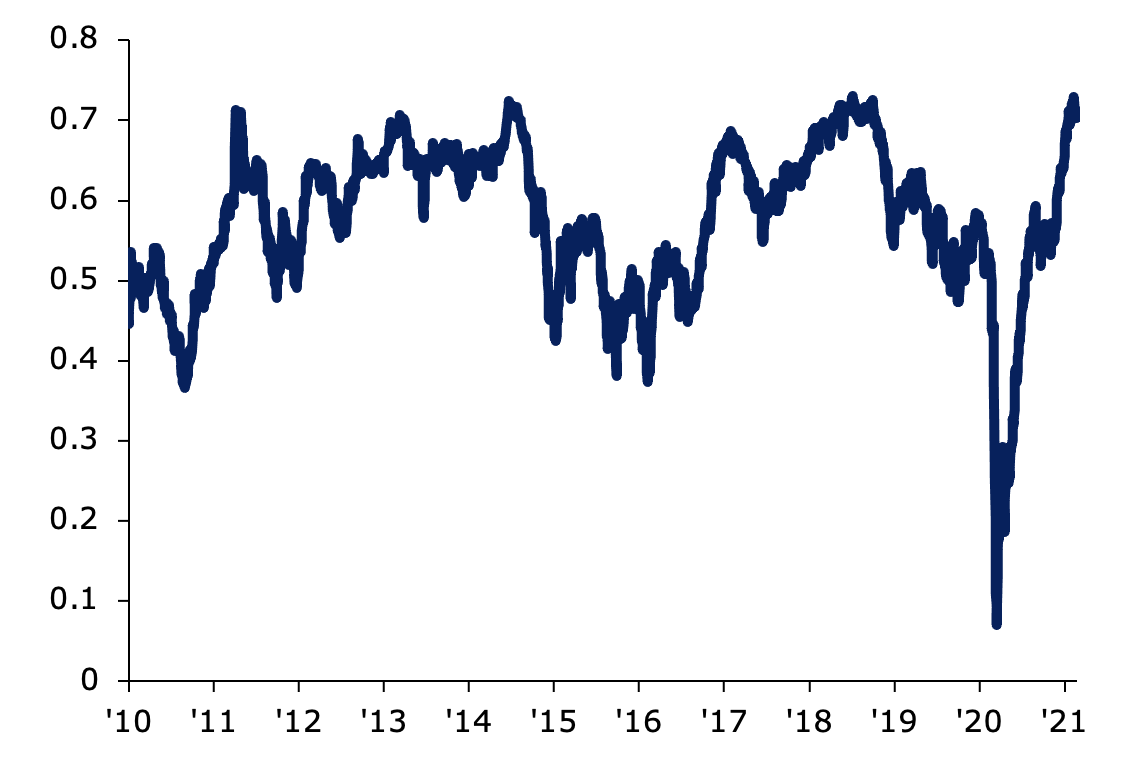
The upward pressure on long-dated yields gained momentum following the Georgia run-off in early January. As a result, market-based inflation expectations, as measured by the 5-year, 5-year forward inflation swap rate, nearly doubled to 2.2% for the first time since the COVID-19 outburst. Hence, the current level of market-based inflation measures is around pre-COVID levels (2018-2019 average: 2.2%). In addition, the rightward shift in the option-implied distribution for US inflation indicates that investors are increasingly hedging against an overshooting of the Fed’s target (Figure 2).4 Market participants currently attach a 60% probability to inflation exceeding 2% in the coming five years. While the central tenet of the AIT framework is well understood, the wide distribution of inflation expectations suggests that markets are relatively uncertain about the exact degree of overshooting until the Fed starts hiking rates. This is underlined by the option-implied standard deviation of the distribution – a proxy for investor uncertainty about future inflation – which is relatively high from a historical perspective (Figure 3). Although the option-implied distribution attributes a 20% chance to inflation exceeding 3%, it seems too early to draw conclusions on potential overheating of the economy.
Figure 2 Option implied distribution for 5-year inflation options
Source: Authors calculations.
Note: The bell curve of the corona outbreak is based on observations from March 9th until the end of April. For the AIT bell curve, observations around the announcement are used (Aug 21-31 2020). Last observation 26-02-2021.
Figure 3 Option-implied inflation uncertainty amongst investors is high, also from historical standards
Source: Authors calculations.
Note: The Figure shows the option-implied standard deviation of 5Y inflation options which measures the width of the distribution. Therefore, it is a proxy for uncertainty around future inflation levels. Last observation 26-02-2021.
Yield curve movements through the lens of a term structure model
We decompose the recent yield curve movements in the 2, 10, and 30-year segment using an affine term structure model on both the US yield and the inflation linked swap (ILS) curve. This allows us to distinguish between the real and inflation component.5 In sum, both higher expected inflation and inflation risk premia, together with lower real rate expectations in the shorter end, suggest that markets understand the FOMC’s newly adopted reaction function under AIT fairly well. More specifically, our analysis confirms that ‘genuinely’ expected inflation – that is, expected inflation corrected for the inflation risk premium (IRP) – rose across the entire curve. In line with the Fed’s guidance to overshoot the inflation target in the short term, genuine inflation expectations at the 2-year horizon increased by 42 basis points since late July (Figure 4a).6
Moreover, at longer maturities, where inflation expectations are arguably better anchored, this contribution has been substantially smaller (6 basis points). Instead, at the 10-year and 30-year horizon, the increase in the IRP dominated, with the largest increases in the weeks succeeding the AIT announcement and the Georgia run-off (Figure 4b and 4c). This observation underlines the increased (upside) uncertainty surrounding the inflation outlook as already indicated by the option-implied distribution. Our decompositions further show that the increase in longer term yields was also driven by an increase in real term premia. This result is consistent with the duration channel given the anticipation of increased debt issuance and better growth prospects following the fiscal accommodation.
Figure 4 Decomposition of the yield curve changes since end July
Source: Authors calculations.
Note: Decomposition based on an affine term structure model. Last observation 14-02-2021.
The ‘fiscal divide’ between the US and the euro area
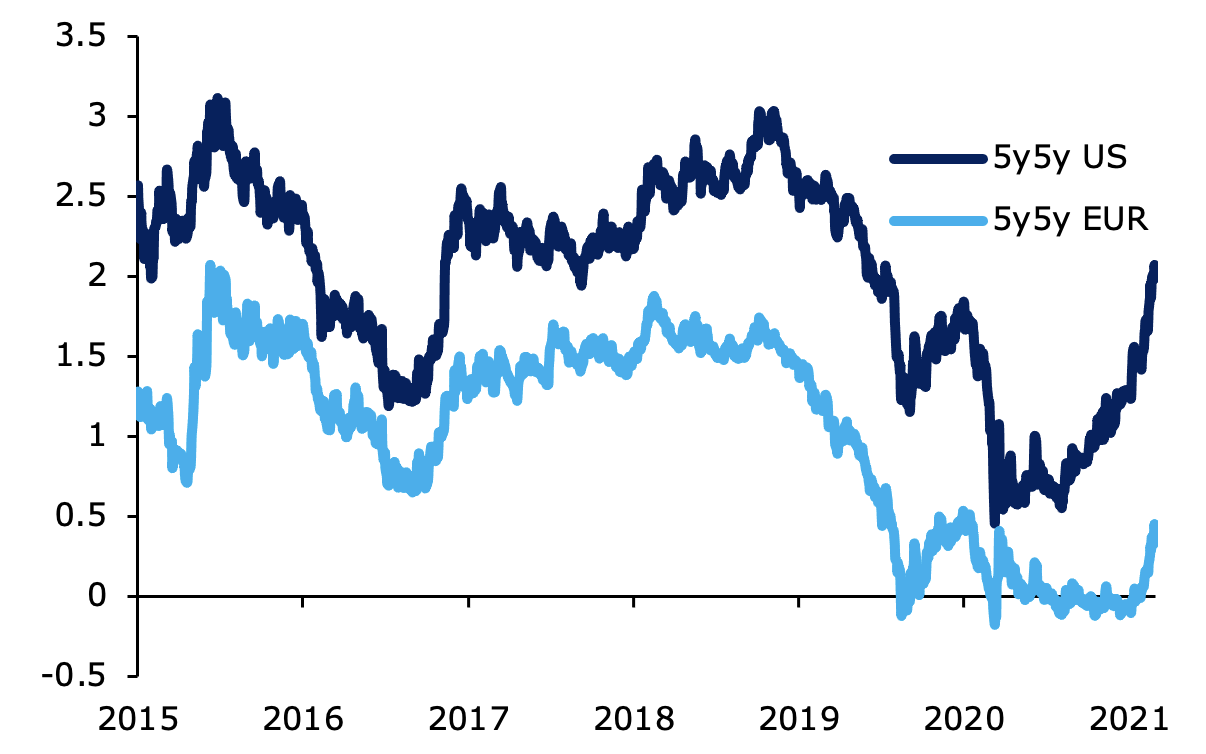
Looking ahead, financial markets foresee a faster recovery of the US economy compared to the euro area. Specifically, the normalisation of the expected long-term policy rate in the US suggests that markets expect a relatively complete recovery with little long-term impact (Figure 5).7 This contrast is also reflected in longer-term market-based inflation expectations. Although the 5-year, 5-year inflation swap rate has also risen in the euro area, the gap between both jurisdictions has further widened to about 90 basis points. One of the main reasons is the difference in the fiscal policy response across both regions.8 While the Biden administration plans to inject around $2.8 trillion this year to address the economic consequences of COVID-19, the euro area only plans to inject some €420 billion.9 To put this into context, the current output gap estimate of the CBO stands at around $535 billion (in 2020Q4). As a result, the discretionary fiscal measures in the US amount to a multiple of the output gap regardless of uncertainty surrounding these estimates. Against this backdrop, market pricing seems to suggest that the fiscal and monetary policy mix has a lasting impact on inflation dynamics.
Figure 5 Long-term expected policy rates in US and euro area
Source: DNB and Bloomberg.
Note: Figure lists the 5y5y OIS forward swaps. Last observation 26-02-2021.
Authors’ note: The views presented are those of the authors and do not reflect the official position of De Nederlandsche Bank or the Eurosystem.
References
Eggertsson, G, S Egiev, A Lin, J Platzer and L Riva (2020), “The Fed’s new policy framework: A major improvement but more can be done”, VoxEU.org, 20 October.
Joslin, S, K J Singleton and H Zhu (2011), “A new perspective on Gaussian dynamic term structure models”, The Review of Financial Studies 24(3): 926-970.
Breeden, D T and R H Litzenberger (1978), “Prices of state-contingent claims implicit in option prices”, Journal of Business 621-651.
Smith, T (2012), “Option-implied probability distributions for future inflation”, Bank of England Quarterly Bulletin, Q3.
Summers, L H (2020), “Trump’s $2,000 Stimulus Checks Are a Big Mistake”, Bloomberg, 27 December.
Endnotes
1 In a recent speech on 10 February 2021, Powell laid out that the Fed sees the current unemployment rate – corrected for the fall in the participation rate – at around 10% and that, therefore, plenty of accommodation is still needed. Powell also stressed that “there was every reason to expect that the labour market could have strengthened even further without causing a worrisome increase in inflation.” As such, Powell sees no risks to inflation even if unemployment falls below 3.5% as in early 2020.
2 Through the more inclusive definition of the employment mandate the Fed indicated it will not raise rates if projected unemployment falls below its natural level
3 The latest dot plot was published at the January meeting of the Federal Reserve. Similarly, but still consistent with the Fed’s guidance, respondents to the Fed’s most recent December survey have also pulled forward the median expected lift-off date from H2 2024 to H1 2024.
4 We use the methodology of Breeden and Litzenberger (1978) and Smith (2012) for deriving option-implied probability distributions from inflation options.
5 We apply the methodology of Joslin et al. (2013) to both the treasury and inflation swap curve.
6 Since the beginning of December, and accelerating at the time of the Democratic win in Georgia, higher uncertainty surrounding the impact of fiscal stimulus on the short term inflation outlook also pushed up the IRP for the 2-year rate (+27bps).
7 The 5-year, 5-year forward rate based on OIS swaps is a proxy for long term policy rates expectations.
8 The faster expected rollout of vaccinations (and the accompanied earlier re-opening of the economy) in the US relative to Europe is another important driver.
9 In the US, the total size of the fiscal stimulus consists of the $900 billion of the December package and the additional $1.9 trillion planned by the Biden administration (which might turn out lower). The euro area package consists of both national measures and the Next Generation EU fund.


