Going to a doctor for a health check-up usually involves being weighed. Weight is a useful piece of information that may indicate something about a person’s eating habits, exercise, and other behaviours. But it does not provide a sufficient basis to assess a person’s health and wellbeing. Doctors thus also measure pulse, temperature, and other examinations to better establish a person’s health.
When it comes to measuring financial development, researchers have often focused on the ratio of private credit to GDP. Recent examples from VoxEU.org include Arcand, Berkes, and Panizza (2011), who used that ratio to examine whether there is too much finance; and Cavallo and Scartascini (2012), who pointed out that many countries still have too little finance, and that this may be due to the impact of interest groups and limited government capabilities on financial development, approximated by private-sector credit to GDP. Much of the empirical evidence on financial system’s role in economic development uses variations of this measure.
This is fine, but looking only at private credit does not provide a sufficient basis for assessing financial development. It would be similar to just ‘weighing in’ at a doctor’s office. The ratio of private credit to GDP is easily available and credit is an important type of financial service. The ratio of private credit to GDP captures the size of a bank’s loan book relative to the economic output, but it says nothing about financial sector components beyond banks, about quality of financial services, efficiency of the financial sector, and its stability. Researchers lack solid cross-country, cross-time measures of the degree to which financial systems perform their functions.
New data
To fill in some of the existing data gaps, we have compiled and released a new dataset, the Global Financial Development Database (World Bank 2012). It is an extensive, publicly available dataset on financial development, containing annual financial-system indicators for more than 200 economies from 1960 to 2011. Returning to the analogy with the doctor’s visit, the database allows us to not only measure financial systems’ weight, but also to take their pulse and temperature. To achieve this, considerable effort was involved in collecting, cleaning and checking this unique database, which builds upon and improves upon several existing data sources. One of the earlier efforts in this area was the Financial Development and Structure dataset, introduced in Beck, Demirgüç-Kunt, and Levine (2000), and updated several times. The Global Financial Development Database extends, updates and recalculates these country-by-country indicators, many of which are based on underlying data for individual institutions and markets. The database is being updated on an ongoing basis as financial systems evolve, and its coverage will increase as more data are compiled.
The Global Financial Development Database provides answers to many interesting questions about how financial systems around the world stack up. For example, which countries have the highest and lowest percentage of adults with formal bank accounts, which country has the most active securities markets, whether competition among banks increased or decreased in recent years, and whether financial institutions and financial markets in developed economies are more or less stable than those in developing ones.
The disparities are huge
The database strikingly demonstrates the massive differences in financial systems around the globe. This is also where the analogy with people going to a doctor breaks down. For example, the tallest adult person on earth is less than five times taller than the smallest person (Guiness World Records). In contrast, the largest financial system in the database is more than 34,500 times the smallest one. Even if the financial systems are rescaled by the size of the corresponding economies (that is, by their GDP), the largest (deepest) financial system is still some 110 times the smallest (least deep) one. And even if the top and bottom 5% of this distribution are taken out, the ratio of the largest to the smallest is about 28 – a large degree of disparity, considering that these are not raw figures but ratios relative to the size of the economy. Similar orders of magnitude are obtained for the other characteristics of financial systems. For example, Denmark has 99.7% of adults covered by bank accounts, compared to only 0.4% in Turkmenistan (246 times higher coverage). Interestingly, Denmark is also the country with the highest turnover/capitalisation ratio in securities markets, at 538, with many countries having that ratio below 1. In short, financial systems demonstrate an amazing degree of differentiation, or unevenness.
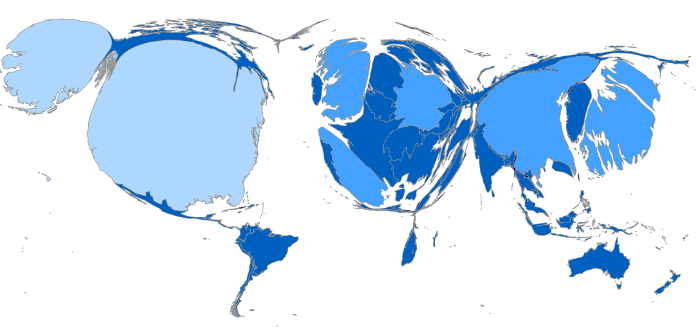
The cartogram in Figure 1 visualises the uneven development of financial systems around the globe. For example, Russia’s financial system is dwarfed by China’s, and Germany’s is bigger than the combined financial systems of all countries in sub-Saharan Africa. The disparities are enormous.
Figure 1. The uneven size of financial systems
Source: Calculations based on the Global Financial Development Database.
Note: The map is for illustration purposes only. Sizes of the various jurisdictions are adjusted to reflect the volume their financial sector assets, in US dollars at the end of 2010. The image was created with the help of MapWindow 4 and ScapeToad software.
Financial systems are multi-dimensional
The database highlights the multidimensional nature of financial systems. The indicators are categorised in four broad categories:
- Size of financial institutions and markets (financial depth).
- Degree to which individuals can and do use financial services (access).
- Efficiency of financial intermediaries and markets in intermediating resources and facilitating financial transactions (efficiency).
- Stability of financial institutions and markets (stability).
All of these four dimensions are measured both for financial institutions – such as banks and insurance companies – and financial markets, such as bond and stock markets. This results in a four by two matrix of main indicators (see Čihák, Demirgüç-Kunt, Feyen, and Levine 2013).
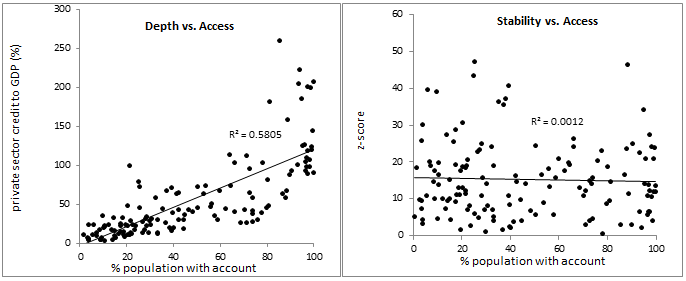
Our paper illustrates that focusing only on financial institutions or only on one characteristic – say, financial depth – would mean missing important aspects of financial systems. Large amounts of credit do not always correspond to broad use of financial services, because the credit can be concentrated among the largest firms and wealthiest individuals. Indeed, as illustrated in Figure 2, the use of formal accounts is imperfectly correlated with a common measure of financial depth – domestic credit to the private sector as a percentage of GDP.
For example, Vietnam has domestic credit to the private sector amounting to 125% of GDP, but only 21% of adults in the country report having a formal account. Conversely, the Czech Republic, with relatively modest financial depth (private credit at 56% of GDP), has relatively high account penetration (81% of adults). This suggests that financial depth and financial inclusion are distinct dimensions of financial development – and that financial systems can become deep without delivering access for all. There is also for example no significant correlation between account penetration and financial stability, as illustrated in the right panel of Figure 2.
Figure 2. Financial depth, stability, and inclusion
Source: Data from and calculations based on the Global Financial Development Database (http://www.worldbank.org/finanacialdevelopment)
Note: Each point corresponds to a country, averages for 2008-2011. The z-score is capital to assets plus return on assets, divided by standard deviation of return on assets. High z-score means low probability of insolvency. For other definitions and a discussion of the 4x2 matrix for benchmarking financial systems, see Čihák and others (2013).
Increasing market power
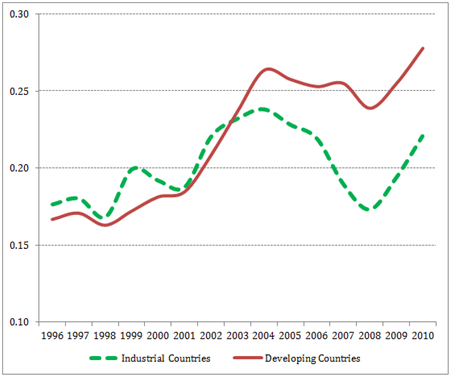
The database also contains unique worldwide data on competition and market power in banking systems around the world. To illustrate, Figure 3 shows the evolution of the Lerner index, a measure of market power measure that compares output pricing and marginal costs (that is, markup). An increase in the Lerner index indicates a deterioration of the competitive conduct of financial intermediaries. The figure illustrates that banking competition worsened after the global financial crisis, both in developing and developed economies.
Figure 3. Bank competition: industrial versus developing countries (Lerner index)
Source: Global Financial Development Database.
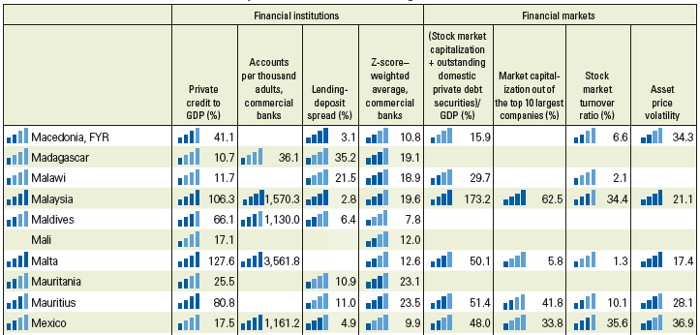
Table 1 illustrates how our four by two framework can be used by comparing a financial system to those in other economies around the world. The data illustrate that deep financial systems do not necessarily provide high degrees of financial access; that highly efficient financial systems are not necessarily more stable than the less efficient ones, and so on.
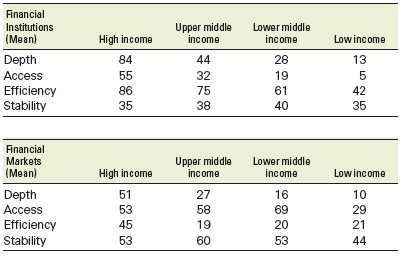
More broadly, when we examine summary statistics for financial systems, we find that financial systems in high-income countries tend to have more depth, provide more access, and are more efficient than those in lower-income countries. However, they score about the same in terms of stability (Table 2).
Table 1. Countries and their financial-system characteristics (example)
Source: Data from and calculations based on the Global Financial Development Database (http://www.worldbank.org/finanacialdevelopment)
Note: The four blue bars summarise where the country’s observation is vis-à-vis the global statistical distribution of the variable in the Global Financial Development Database. Each blue bar corresponds to one quartile of the statistical distribution. The blue bars on the far left are based on a simple (unweighted) average of the eight financial characteristics, each converted to a 0-100 scale. For details, see Čihák and others (2013).
Table 2. Financial-system characteristics summary, by income group, 2010
Source: Data from and calculations based on the Global Financial Development Database (http://www.worldbank.org/finanacialdevelopment)
Note: The indicators are on a scale from 0 to 100, relative to the distribution of the variables for 203 jurisdictions in 1960-2010. Financial Institutions—Depth: private credit/GDP (%); Access: number of accounts per 1,000 adults, commercial banks; Efficiency: net interest margin; Stability: z-score. Financial Markets—Depth: (stock market capitalisation + outstanding domestic private debt
References
Arcand, Jean-Louis, Enrico Berkes, and Ugo Panizza (2011), “Too much finance?”, VoxEU.org, 7 April.
Beck, Thorsten, Aslı Demirgüç-Kunt, and Ross Levine (2000), “A New Database on the Structure and Development of the Financial Sector”, World Bank Economic Review 14(3), 597–605.
Beck, Thorsten, Aslı Demirgüç-Kunt, and Ross Levine (2010), “Financial Institutions and Markets across Countries and over Time: The Updated Financial Development and Structure Database”, World Bank Economic Review 24(1), 77-92.
Cavallo, Eduardo, and Carlos Scartascini (2012), “Interest groups and government capabilities matter for financial development”, VoxEU.org, 12 May.
Čihák, Martin, Aslı Demirgüç-Kunt, Erik Feyen, and Ross Levine (2013), “Benchmarking Financial Systems around the World”, NBER Working Paper 18946, National Bureau of Economic Research.
Guinness World Records (no date), website, http://www.guinnessworldrecords.com/.
World Bank (2012), Global Financial Development Report 2013: Rethinking the Role of the State in Finance, World Bank, Washington DC.


