Measuring economic activity in real time is crucial for the implementation of macroeconomic policies. However, it is also a challenge due to a lack of sufficient high-frequency data, data publication lags, and measurement errors/revisions of key economic aggregates.
Many methods have been proposed to provide policymakers with a real-time assessment of economic conditions in this challenging environment (Banbura et al. 2011). The Aruoba-Diebold-Scotti (ADS) index (Aruoba et al. 2009) is such a tool. It aims to ‘nowcast’ real economic activity growth using a dynamic factor model with multiple mixed-frequency real activity indicators, which are assumed to be driven by a single latent real activity factor, in the tradition of Stock and Watson (1989). The ADS index is an estimate of that latent real activity factor, produced using the Kalman smoother.
ADS is designed at daily frequency, allowing as necessary for missing data for the less-frequently observed variables. In practice, it has been updated and re-calculated approximately eight times per month, whenever new data are released, or old data are revised. With each data release, the historical ADS path can change as the Kalman smoother is re-run. The entire history of ADS paths is available on the Federal Reserve Bank of Philadelphia website.1
Nowcasting becomes particularly vital in turbulent economic periods that require rapid policy actions. The role of the ADS index is to provide a reliable real-time assessment of economic conditions well before official data on growth becomes available. ADS went ‘live’ in December 2008, and the ensuing Great Recession exit and pandemic recession entry provide opportunities to assess its real time performance (Diebold 2020).
Exiting the Great Recession
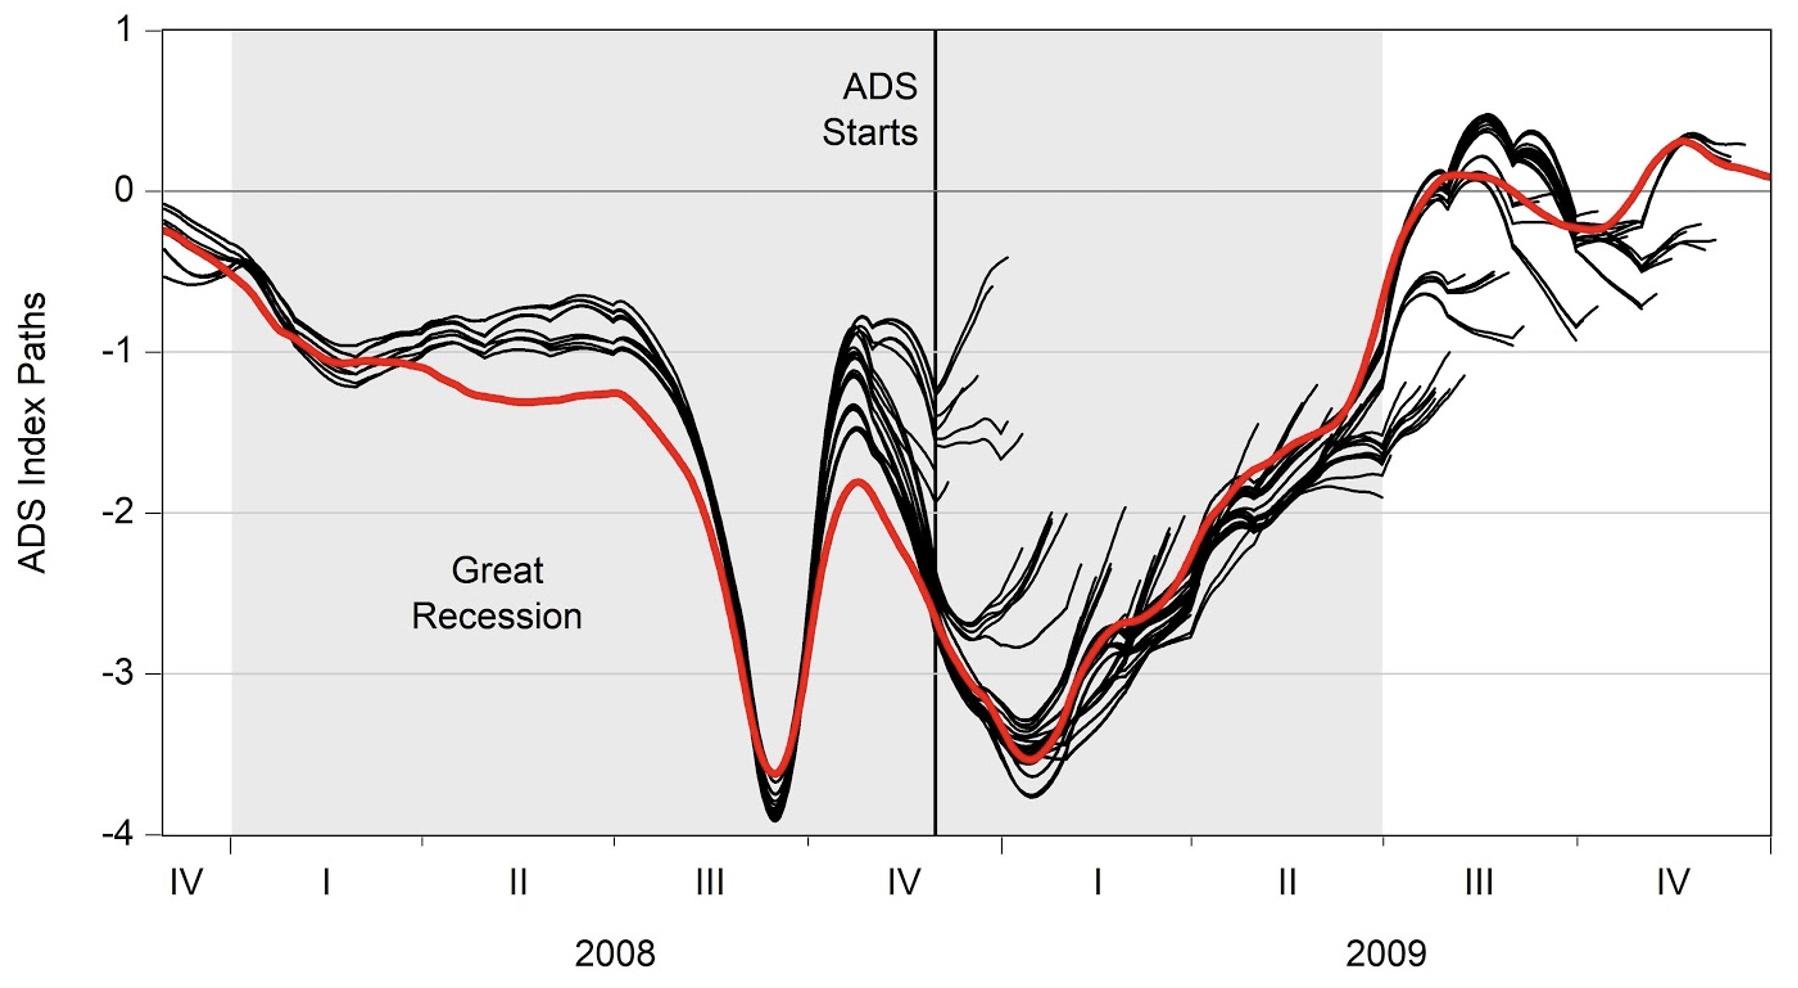
Later we will focus on the pandemic recession, but an earlier period of economic instability – the exit from the Great Recession – will provide a warm-up and contrast. In Figure 1 we show the real-time ADS paths in black and a late-vintage path in red (think of the red path as ‘truth’).2 The real-time paths provide reliable estimates of the late-vintage path during the recession exit. In addition, ADS signals the recession’s end long before the official NBER announcement in December 2010. The ADS index’s good performance exiting the Great Recession suggests its reliability more generally. Against that background, and also considering that the Great Recession and pandemic recession are similar in certain key respects (Lustig and Mariscal 2020), we now turn to the pandemic recession entry.
Figure 1 Exiting the Great Recession: Real-time ADS path plot
Entering the pandemic recession
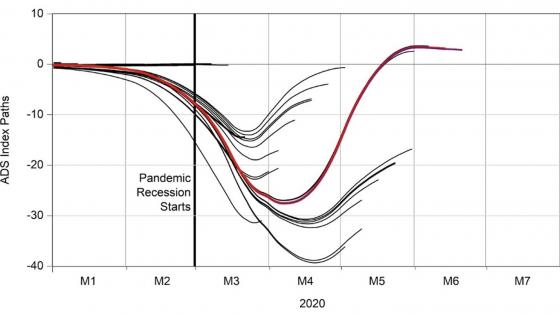
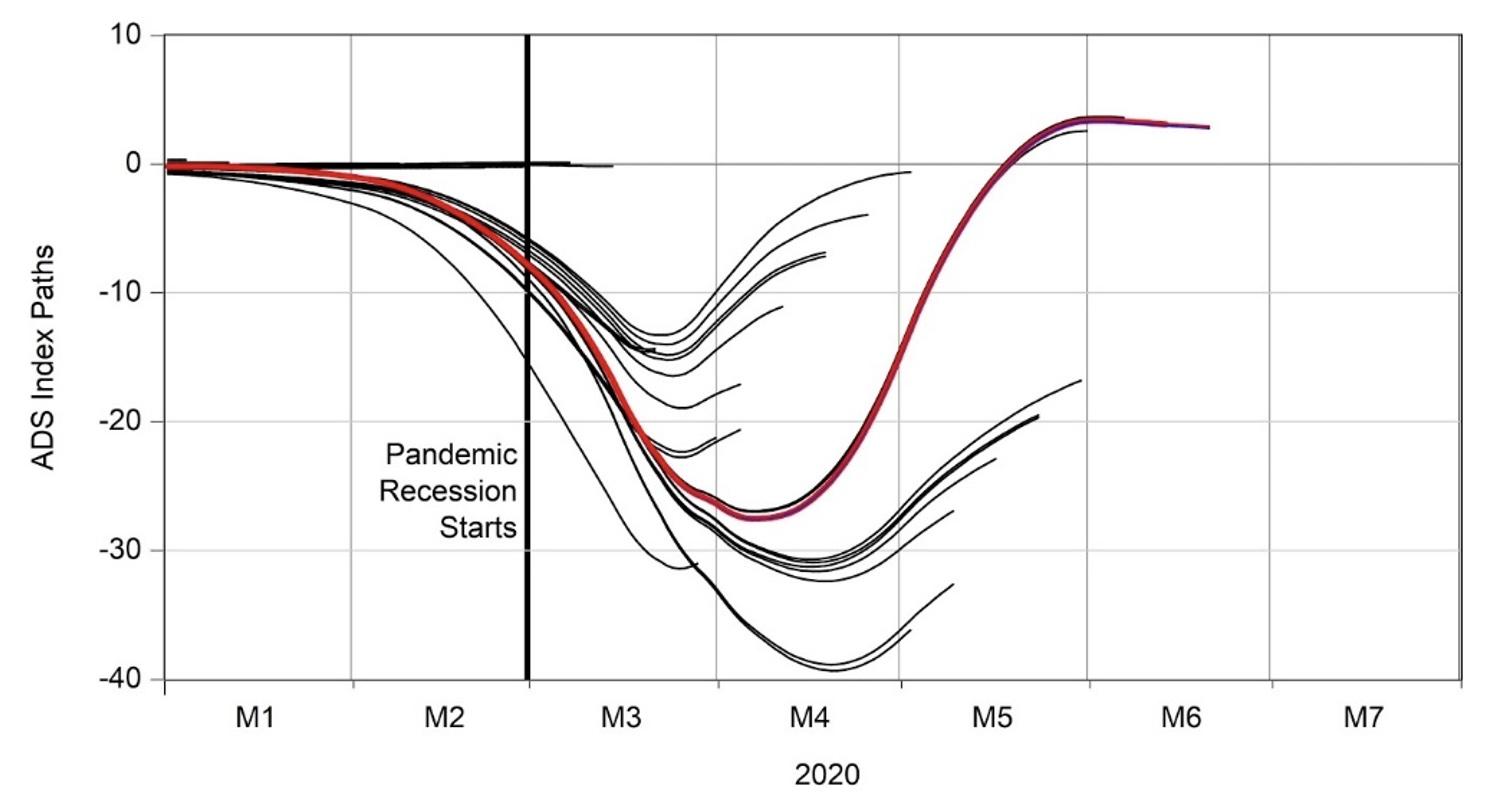
Figure 2 shows all ADS paths during the pandemic recession entry, through to June 2020. Three ‘meta-paths’ stand out. The first extends through the 19 March 2020 ADS announcement, where the ADS barely moves. The Kalman smoother optimally but erroneously ascribes the abnormal rise in the initial claims as measurement error. The second begins with the 26 March and 2 April 2020 initial claims spikes. ADS plunges due to the bad news from the labour market but recovers swiftly in less than a month. The third begins with the horrific 8 May 2020 April payroll employment release, with ADS plunging severely, but it begins mean-reverting and finally goes back to positive territory after the strong comeback of the May payroll number.3 All told, the pandemic recession entry was a time of historically unprecedented (indeed almost unfathomable) economic stress, so one would expect ADS to have a harder time there, and its signals are indeed noisier, but they are nevertheless valuable.
Figure 2 Entering the pandemic recession: Real-time ADS path plot
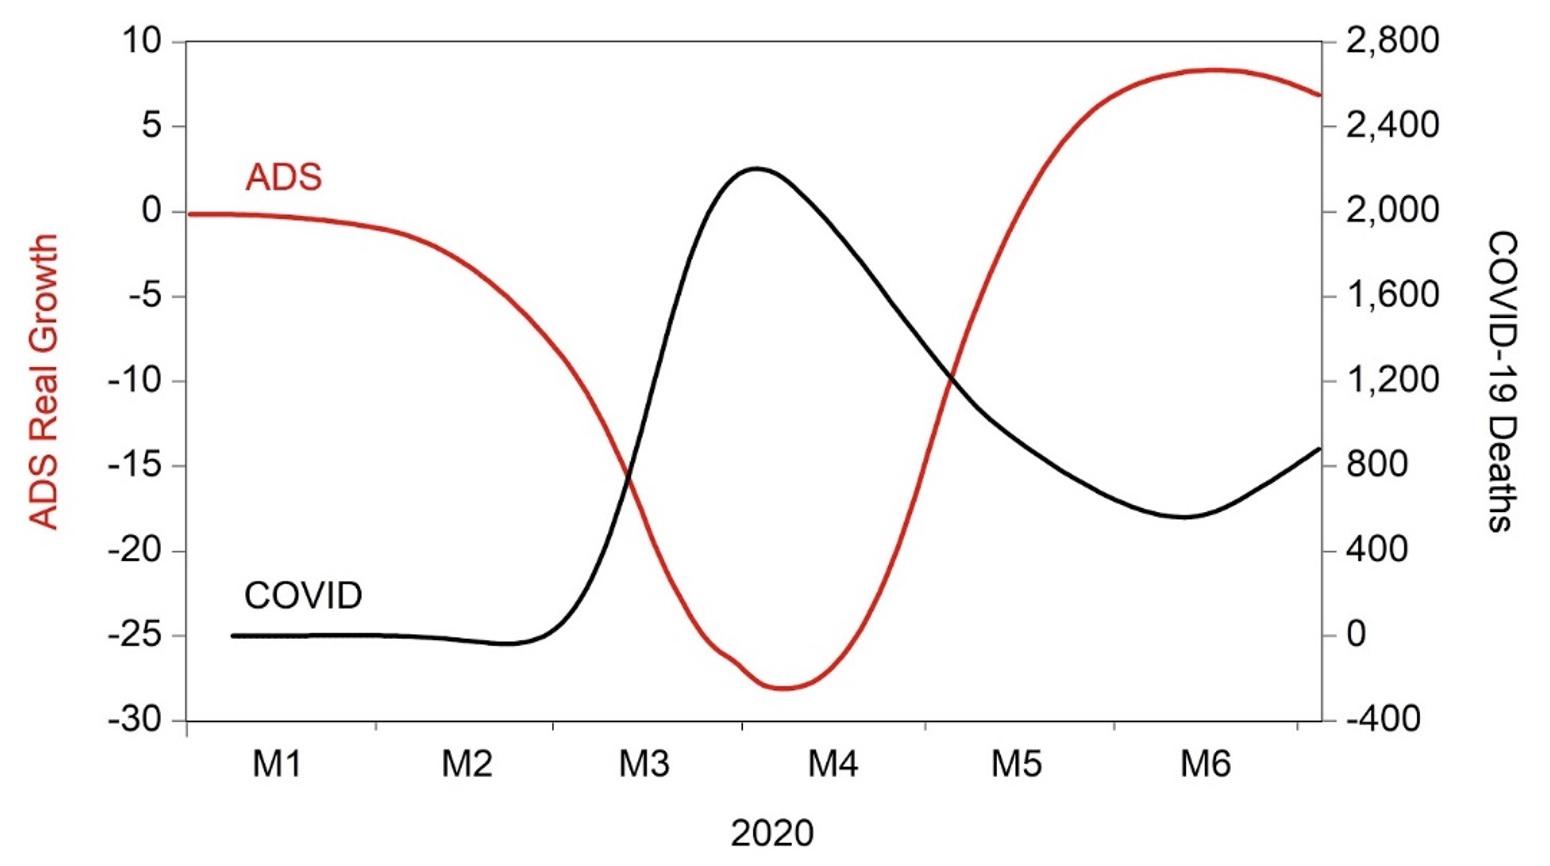
We can further assess ADS performance entering the pandemic recession by seeing whether it is correlated in expected ways with other variables, such as COVID spread (Wei 2020). In particular, it is interesting to examine whether day-by-day real economic activity as measured by ADS is related to day-by-day COVID cases. One would naturally expect a negative correlation – as new COVID cases increase, economic activity should decrease. Figure 3 depicts the ADS index in red and COVID deaths led by 20 days (a good measure of new COVID cases) in black. ADS and COVID are indeed extremely highly negatively correlated.
Figure 3 Daily ADS and smoothed daily COVID-19 deaths
Conclusion
The Great Recession exit and the pandemic recession entry are two major business-cycle events that have occurred since the ADS index went live in December 2008. ADS provided reliable real time signals in each case, although they were understandably noisier when entering the pandemic recession. ADS indicates a clear return to normal growth (indeed much better than normal) by mid-May 2020, and it is strongly negatively correlated with new COVID-19 cases through June 2020.
Author's note: I am grateful to the Penn Econometrics Research Group for valuable assistance in preparing this column.
References
Aruoba, S B, F X Diebold, and C Scotti (2009), “Real-time Measurement of Business Conditions”, Journal of Business and Economic Statistics, 27, 417-427.
Banbura, M, D Giannone, and L Reichlin (2011), “Nowcasting”, In M Clemens and D Hendry (eds.), Oxford Handbook of Economic Forecasting, 193-224.
Diebold, F X (2020), “Real-Time Real Economic Activity Entering the Pandemic Recession”, Covid Economics 62, 1-19.
Lustig, N, and J Mariscal (2020), “How COVID-19 Could be Like the Global Financial Crisis (or Worse)”, in R Baldwin and B Weder di Mauro (eds.), Mitigating the COVID Crises: Act Fast and Do Whatever It Takes, VoxEU.org, 185-190.
Wei, S-J (2020), “Ten Keys to Beating Back COVID-19 and the Associated Economic Pandemic”, in R Baldwin and B Weder di Mauro (eds.), Mitigating the COVID Crises: Act Fast and Do Whatever It Takes, VoxEU.org, 71-76.
Stock, J H, and M W Watson (1989), “New Indexes of Coincident and Leading Economic Indicators”, in O J Blanchard and S Fischer (eds.), NBER Macroeconomics Annual, MIT Press, 351-393.
Endnotes
1 See https://www.philadelphiafed.org/surveys-and-data/real-time-data-research/ads.
2 The recession period is shaded.
3 ADS tracks de-meaned real activity growth, and progressively more negative or positive values indicate progressively worse- or better-than-average real growth. A positive value does not necessarily mean ‘good times’. Instead, it means ‘good growth’ – potentially from a terrible level, as began in May.
