To limit climate change, countries and firms are increasingly pledging to reduce carbon dioxide (CO2) emissions. Reaching this goal could substantially boost demand for metals like copper, nickel, cobalt, and lithium. Low-greenhouse-gas technologies – including renewable energy, electric vehicles, hydrogen, and carbon capture – require more metals than their fossil-fuel-based counterparts (World Bank 2020, International Energy Agency 2021a, 2021b).
If metal demand ramps up and supply is slow to react, a multiyear price rally may follow – possibly derailing or delaying the energy transition. To shed light on the issue, our new paper (Boer et al. 2021), together with the related IMF World Economic Outlook’s Commodity Special Feature (IMF 2021) introduce ‘energy transition’ metals, estimates price elasticity of supply, and presents price scenarios for major metals. We also provide estimates for revenues and identify which countries may benefit.
Soaring demand for energy transition metals
Our analysis focuses on copper, nickel, cobalt, and lithium. These metals are considered as the most important metals that are highly affected by the energy transition (World Bank 2020, International Energy Agency 2021b). Copper and nickel are well-established metals that have been traded for more than a century on metal exchanges. They are used broadly across the economy and across low carbon technologies. Cobalt and lithium, instead, are minor but rising metals. They started being traded on metal exchanges in the 2010s and have gained in popularity, mainly because they are used in batteries.
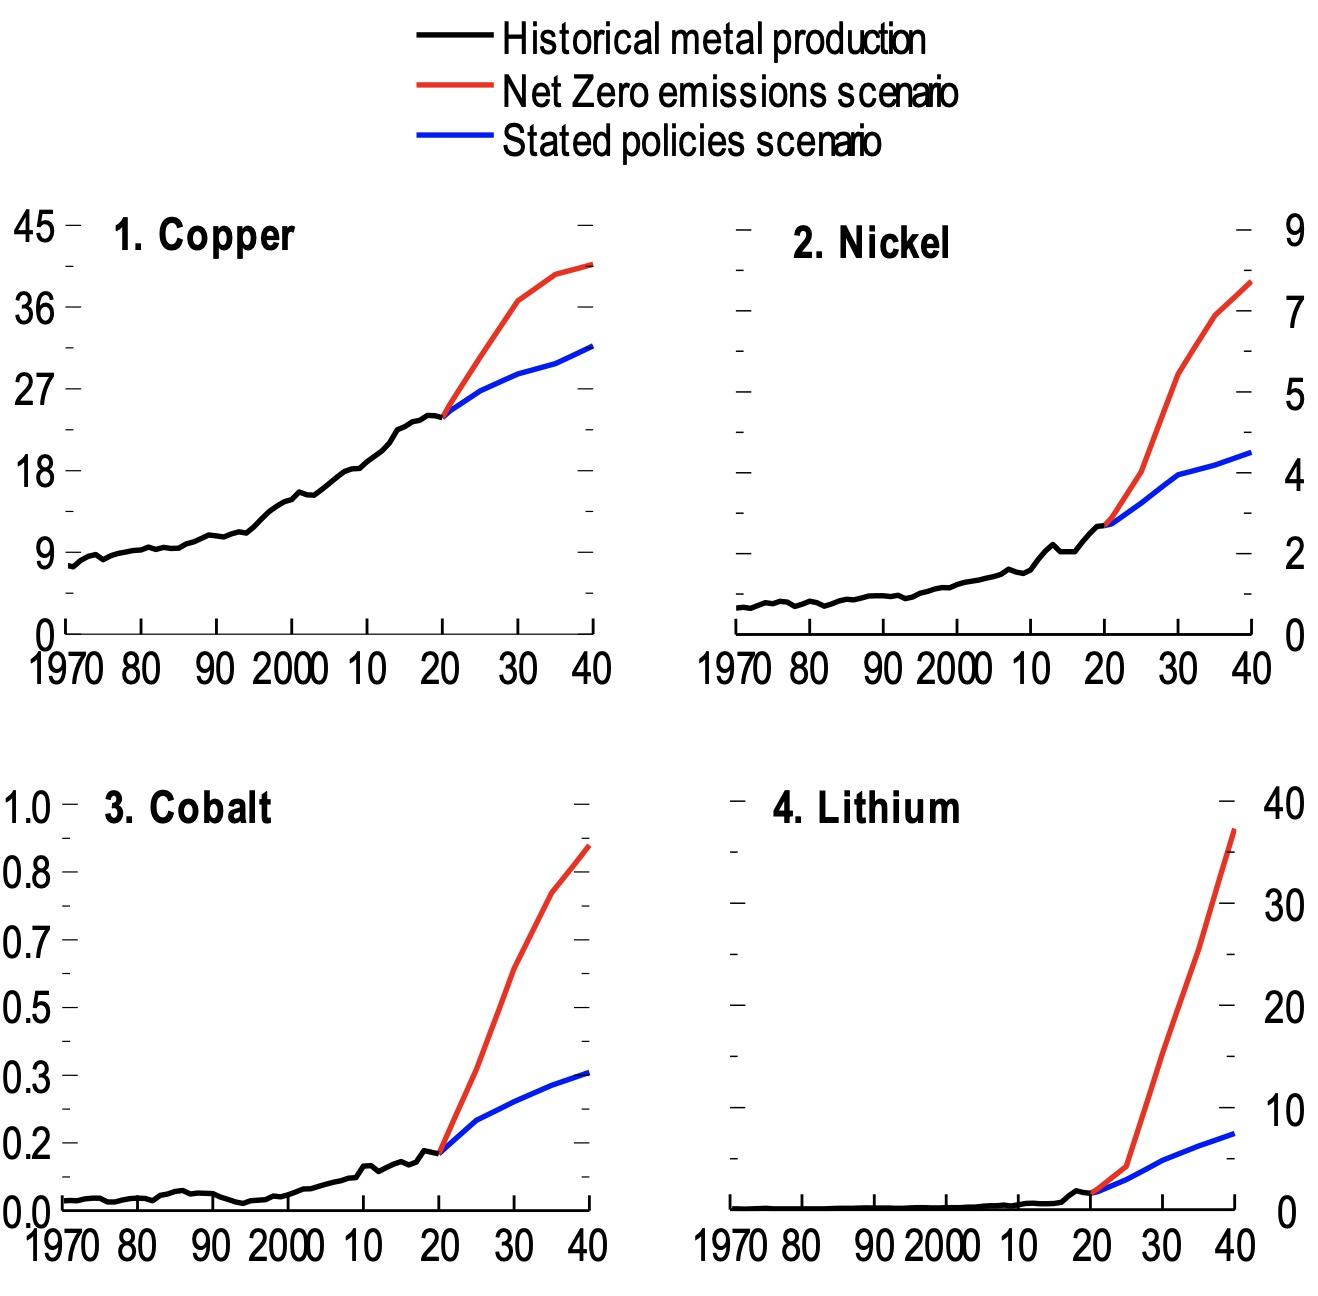
Figure 1 Historical metal production and IEA energy transition scenarios (million metric tonnes)
Sources: IEA; Schwerhoff and Stuermer (2020); US Geological Survey; IMF staff calculations.
Note: Copper and nickel refer to refined production, while cobalt and lithium refer to mine production.
A fast-paced transition that is consistent with the ‘net zero’ scenario of the International Energy Agency (IEA), implies soaring demand for metals over the next decade (see Figure 1). In this scenario, the total consumption of lithium (Li) and cobalt (C) rises by a factor of more than six, driven by clean energy demand (mostly batteries). Similarly, copper (Cu) shows a twofold increase and nickel (Ni) a fourfold increase in total consumption (including demand unrelated to clean energy). In contrast, the increase in metals consumption is much more modest in the IEA’s ‘stated policies’ scenario (a slow-paced energy transition scenario that is inconsistent with climate goals).
How elastic is the supply of metals in the long run?
While metals demand could soar, the supply of metals typically reacts slowly to price signals. This depends, in part, on production methods. Copper, nickel, and cobalt are extracted in mines, which often require capital intensive investment and take as long as 19 years to construct. In contrast, lithium is often extracted from mineral springs and brine as salty water is pumped from the earth. As such, lead times to open new production facilities are shorter.
To estimate supply elasticities at different horizons, separate structural vector autoregressive (VAR) models and data are used for each metals market, including global economic activity, metals output, and real prices from 1879 to 2020 (where available). VAR models are a standard way to model commodity markets (Kilian 2009, Baumeister and Hamilton 2019, Stuermer 2018, Jacks and Stuermer 2020).
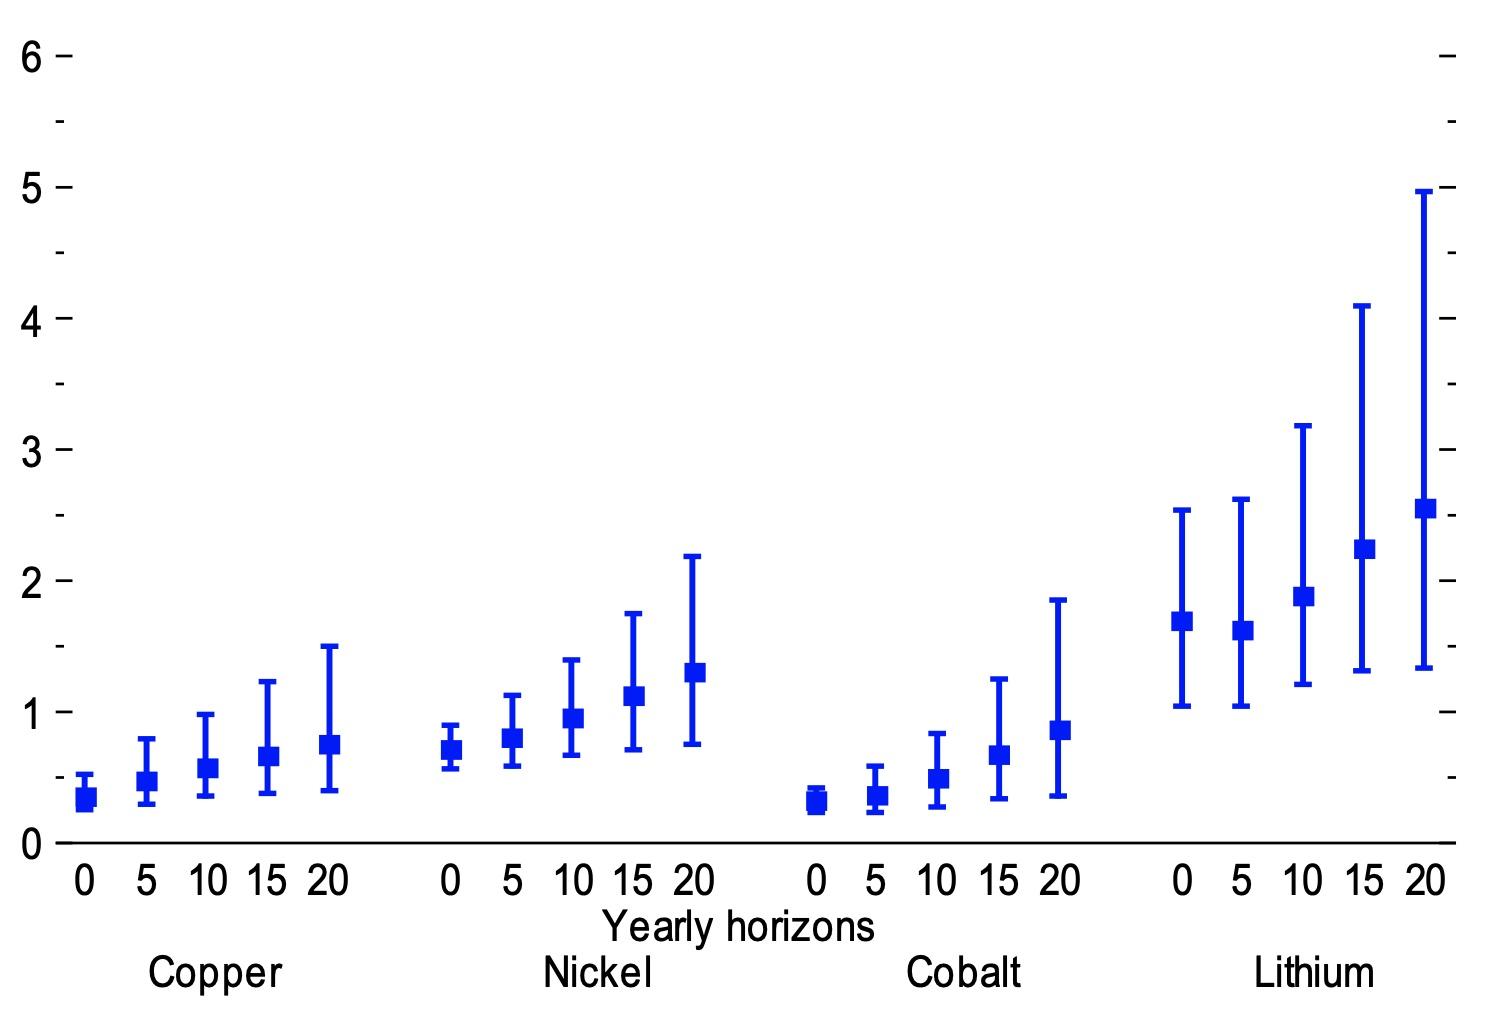
Results suggest that supply is quite inelastic over the short term but more elastic over the long term (Figure 2). A demand-induced positive price shock of 10% increases the same-year output of copper by 3.5%, nickel 7.1%, cobalt 3.2%, and lithium 16.9%. After 20 years, the same price shock raises the output of copper by 7.5%, nickel 13%, cobalt 8.6%, and lithium 25.5%.
Figure 2 Supply elasticities for selected metals
Sources: Schwerhoff and Stuermer (2020); US Geological Survey; IMF staff calculations.
Note: Supply elasticities are the ratio of the change in price and output from horizon 0 to 20 years, derived from metal-specific demand shocks. Lower and uppoer bounds are the 16th and 84th percentiles, respectively. See online appendix 1.SF.1 for methodology..
Identifying metal-specific demand shocks analog to the energy transition
We propose an anchor variable as a new way to identify shocks in our structural VAR models. This variable helps us disentangle metal-specific demand shocks (such as the energy transition)from aggregate demand shocks. We do so by assuming that while a positive aggregate demand shock will lift both the metal and cotton prices, the metal-specific demand shock has no initial impact on the cotton price. We are agnostic on its impact on aggregate activity. In addition, we employ zero sign and narrative sign restrictions.
The above identification strategy allows us to construct structural price scenarios following Antolin-Diaz et al. (2021). We pin down a series of exogenously and metal-specific demand-driven price shocks that incentivise the production path needed for the energy transition in the different IEA scenarios. A price path implied by these shocks is then derived.
Metal prices could reach historic peaks for an unprecedented sustained period
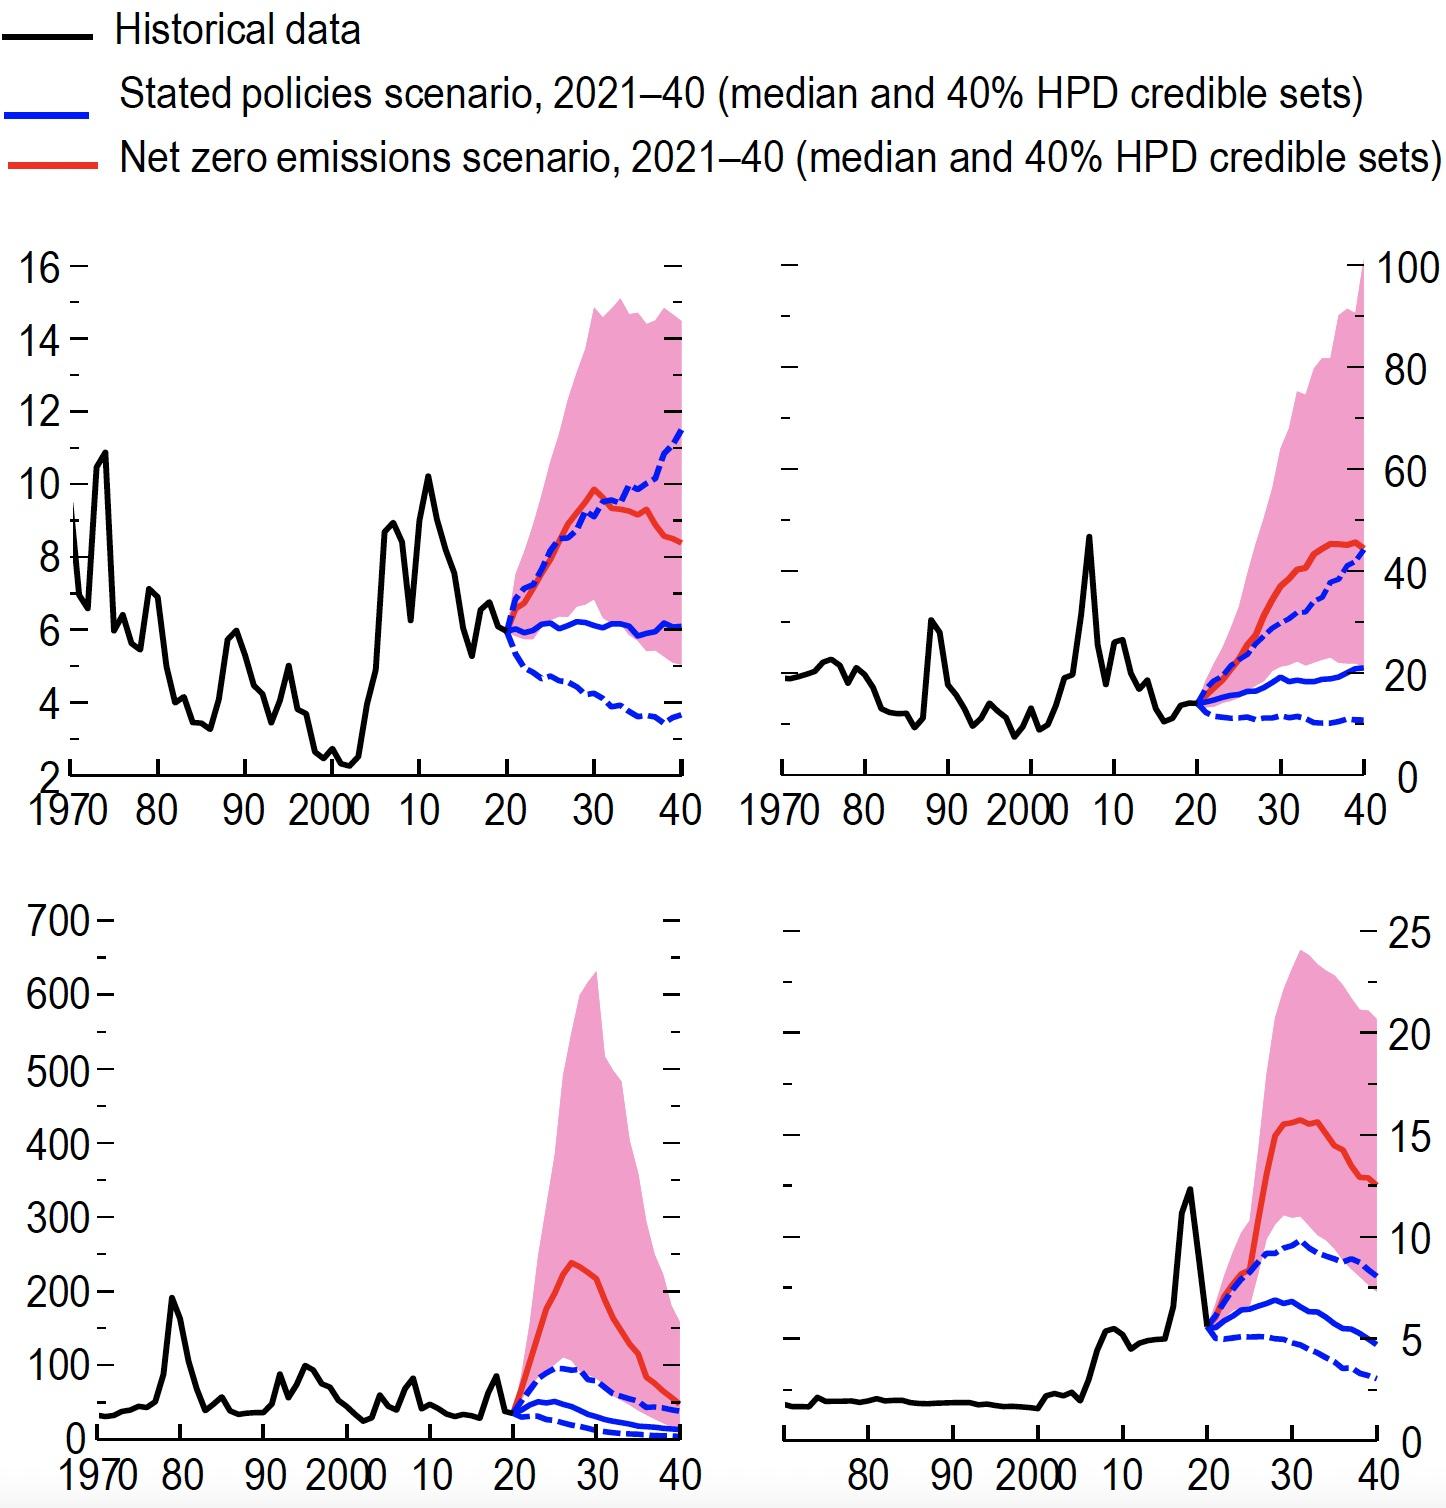
The four metals are potential bottlenecks for the energy transition. Inflation-adjusted metal prices would reach peaks similar to historical ones but for an unprecedented sustained period of roughly a decade in the IEA’s net zero emissions scenario (Figure 3). This would imply that real prices of nickel, cobalt and lithium would persistently rise several hundred percent from 2020 levels, while the copper price would increase more than 60%. In the IEA’s stated policy scenario, real prices would broadly stay in the range of the 2020 average.
Figure 3 Price scenarios for the stated policies scenario and the net zero emissions scenario (thousands of 2020 US dollars a metric tonne)
Sources: International Energy Agency; Schwerhoff and Stuermer (2020); US Bureau of Labor Statistics; US Geological Survey; IMF staff calculations.
Notes: HPD = highest posterior density. Note: Prices were adjusted for inflation using the US Consumer Price Inflation Index. The scenarios are based on a metal-specific demand shock. See Online Annex 1.SF.1 for the data descriptions and methodology.
Prices peak mostly around 2030 for two reasons. First, the steep rises in demand are frontloaded in the net zero emissions scenario. Unlike fossil-fuel-based energy production, renewable energy production uses metals up front – for example, to build wind turbines. Second, the price boom induces a supply reaction, reducing market tightness after 2030.
Potential value of metal production could rival crude oil
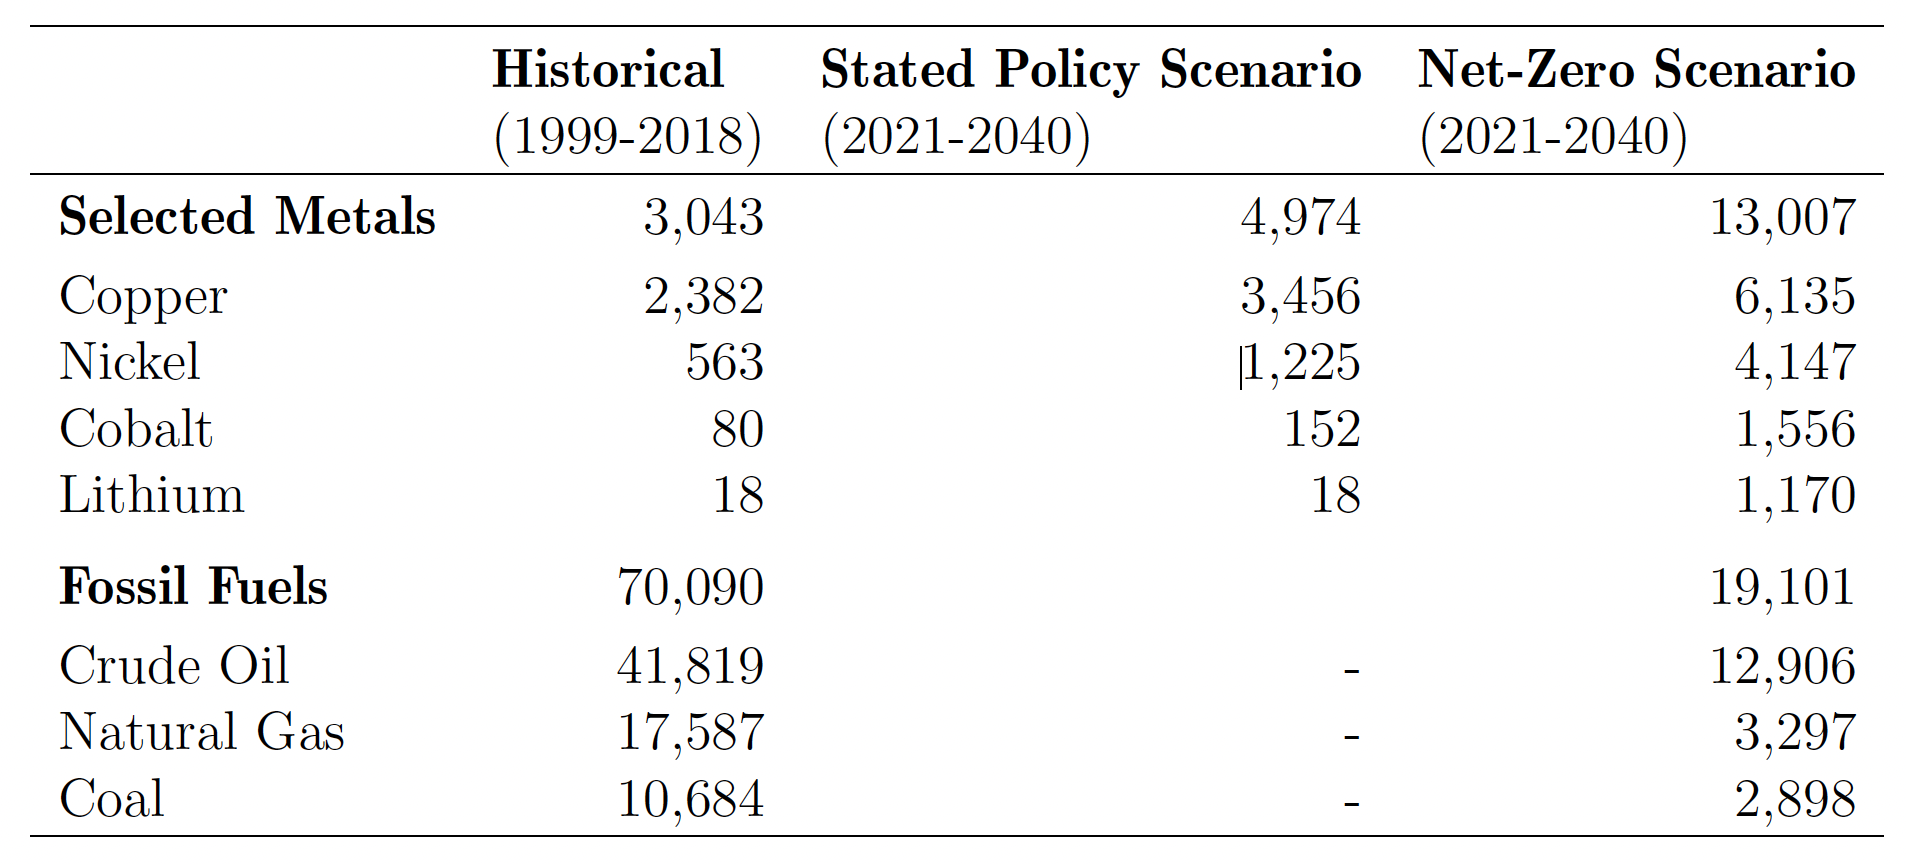
In the net zero emissions scenario, the demand boom could lead to a more than fourfold increase in the value of metals production – totaling $13 trillion accumulated over the next two decades for the four metals alone. This could rival the estimated value of oil production in a net zero emissions scenario over that same period (see Table 1). This would make the four metals macro-relevant for inflation, trade, and output, and provide significant windfalls to commodity producers.
Table 1 Estimated cumulated real revenue for the global production of selected energy transition metals, 2021-40 (billions of 2020 US dollars)
Sources: International Energy Agency; IMF staff calculations.
Note: For 2021-2040, prices of $30 a barrel for oil, $1.50 a million British thermal units for natural gas, and $40 a metric tonne for coal are assumed.
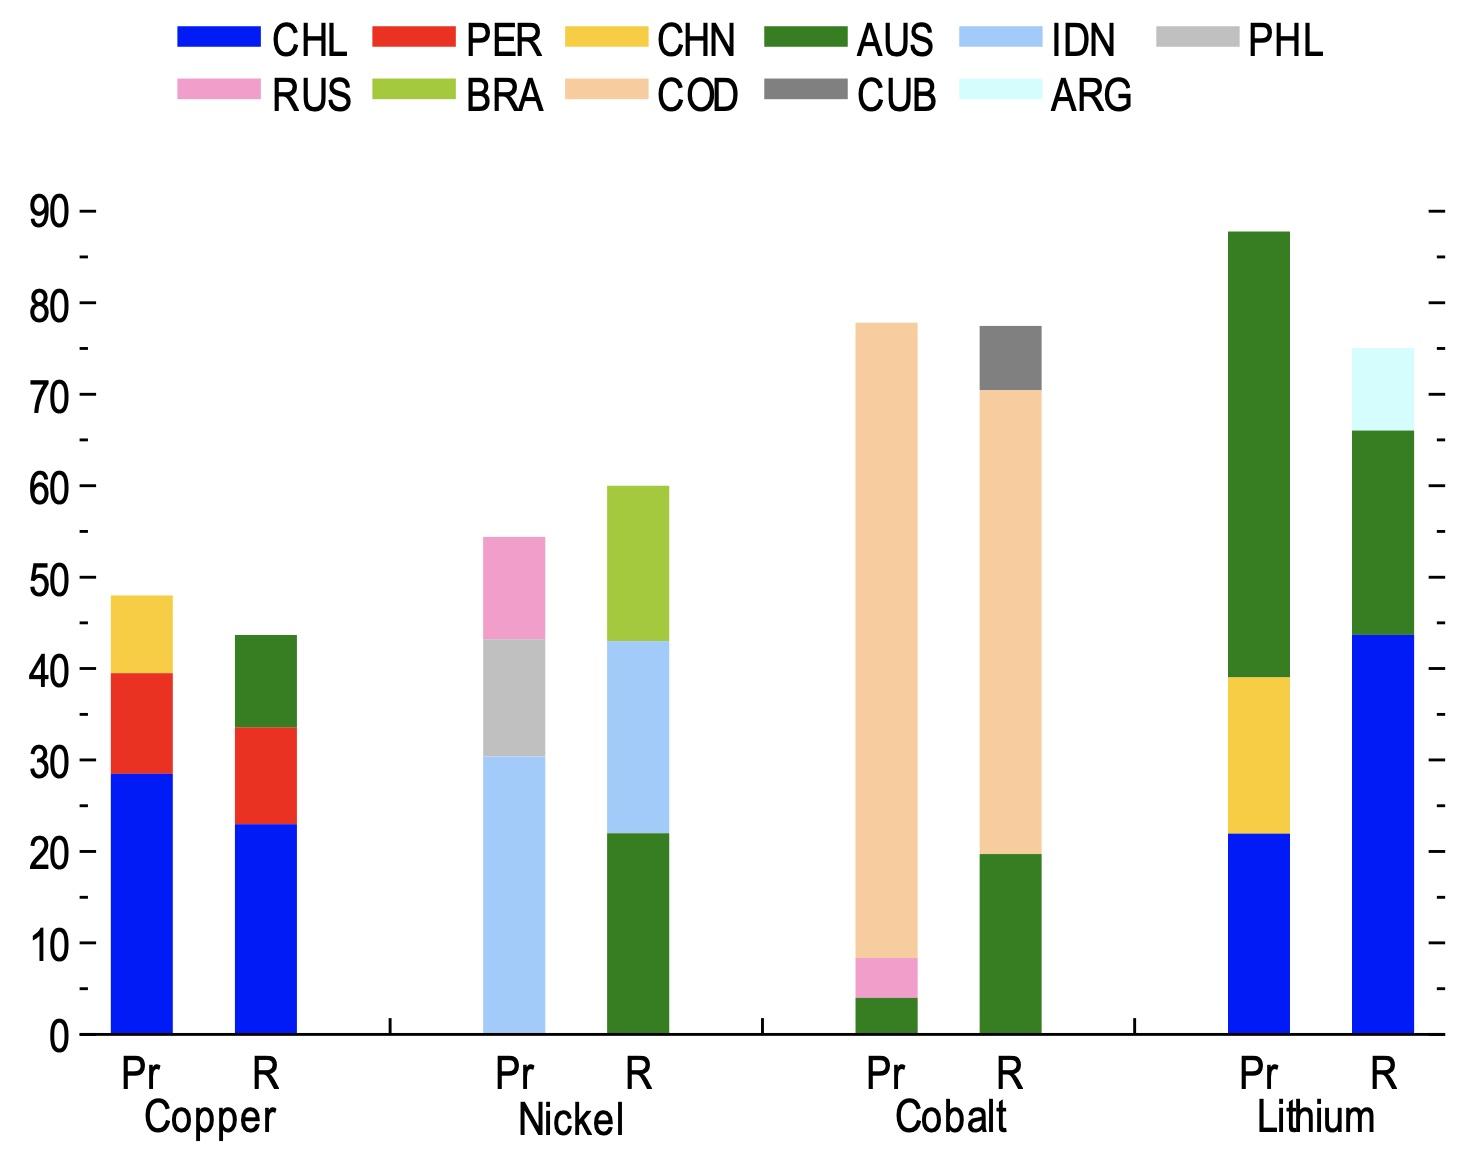
The supply of metals is quite concentrated, implying that a few top producers may stand to benefit. In most cases, countries that have the largest production have the highest level of reserves and are therefore likely to be prospective producers. The Democratic Republic of the Congo, for example, accounts for about 70% of global cobalt output and 50% of reserves (Figure 4). Other countries that stand out in production and reserves include Australia (for lithium, cobalt, and nickel); Chile (for copper and lithium); and, to lesser extent, Peru, Russia, Indonesia, and South Africa.
Figure 4 Top three countries by share of global production and reserves for selected metals (percentage points)
Sources: US Geological Survey; IMF staff calculations.
Note: Data labels in the figure use International Organization for Standardization (IOS) country codes. Pr = production; r = reserves.
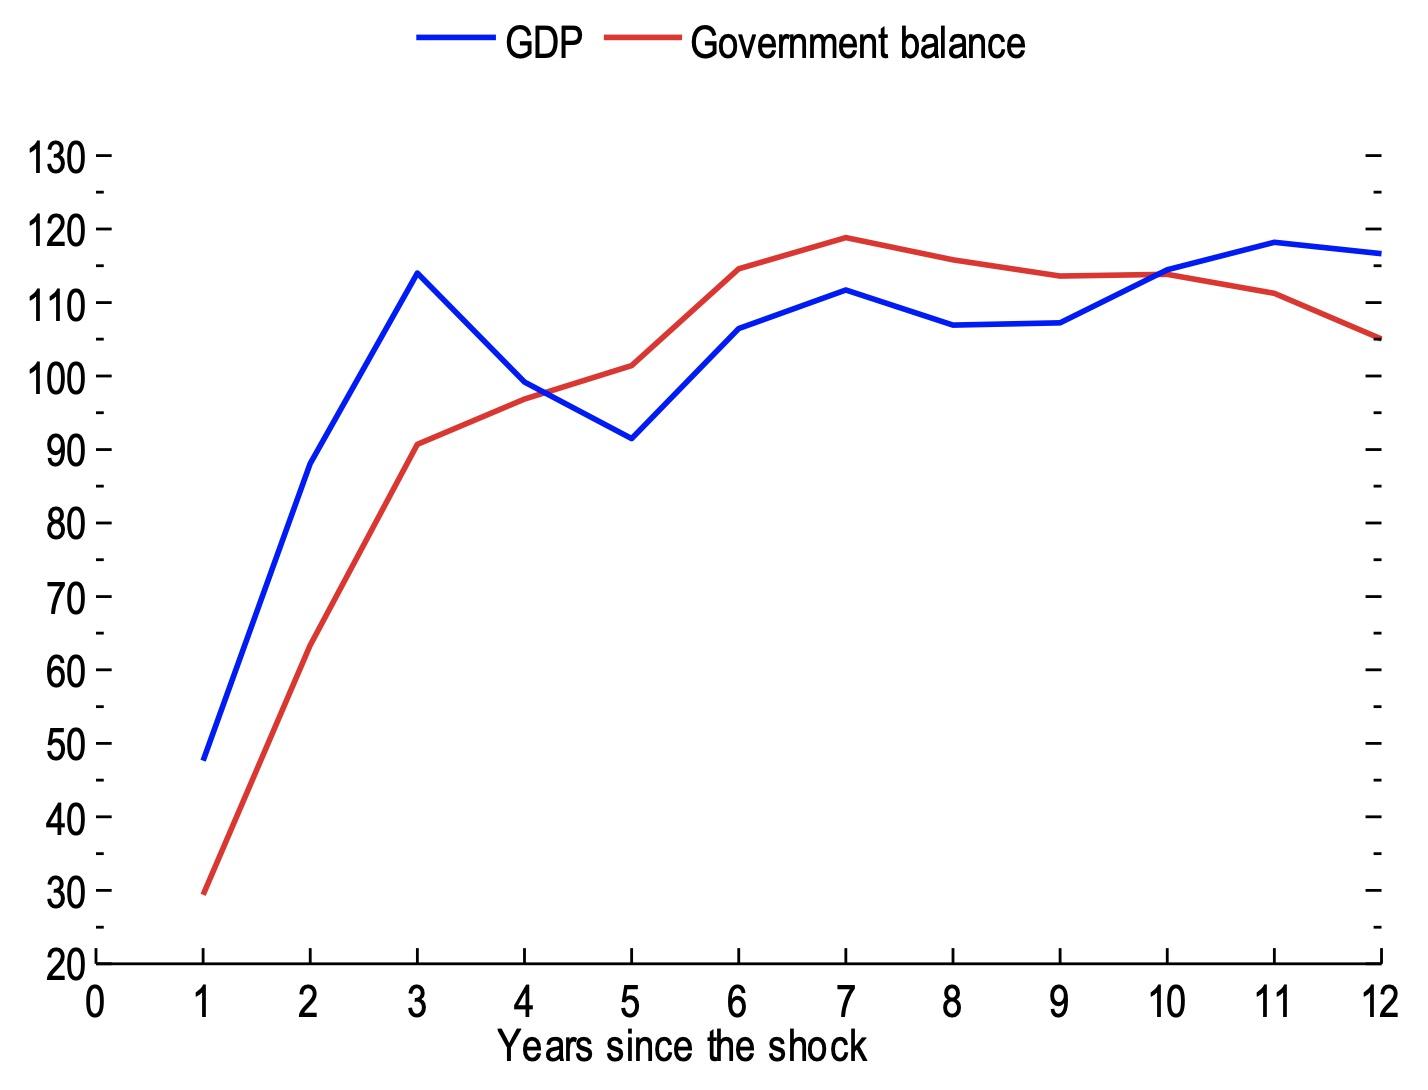
A long-lasting metals commodity price boom could translate into substantial macroeconomic gains, especially for metals exporters. In fact, a 10% persistent increase in the Commodity Research Bureau (CRB) metal price index adds an estimated extra two-thirds of a percentage point of real GDP growth for metals exporters relative to importers (see Figure 5). The estimated improvement of metal exporters’ fiscal balance is of a similar magnitude. These estimates are derived from generalised impulse responses of a panel VAR model that includes each country’s real GDP growth rate, government balance-to-GDP ratio, current account-to-GDP ratio, and the CRB’s real metal price index (year-on-year growth rate), together with global GDP growth and annual changes in real oil prices as additional control variables.
Figure 5 Impact of metal price shocks on exporters (basis points)
Source: IMF calculations.
Note: The figure shows panel vector autoregression generalised impulse reponses following Persaran and Shin (1998) for the differences in GDP growth and the general government balance-to-GDP ratio of the 15 largest importers for a one standard deviation shock to metal prices (about 15%).
Policies to reduce uncertainty
High uncertainty surrounds the demand scenarios. First, technological change is hard to predict. Second, the speed and direction of the energy transition depend on policy decisions.
High policy uncertainty is detrimental as it may hinder mining investment and increase the chances that high metal prices will derail or delay the energy transition.
A credible, globally coordinated climate policy; high environmental, social, labour, and governance standards; and reduced trade barriers and export restrictions would allow markets to operate efficiently. This would direct investment to sufficiently expand metal supply, thereby avoiding unnecessarily increasing the cost of low-carbon technologies and supporting the clean energy transition.
Finally, an international institution with a mandate covering metals – analogous to the IEA for energy and the Food and Agricultural Organization for agricultural goods – could play a pivotal role in data dissemination and analysis, industry standards, and international cooperation.
References
Antolin-Diaz, J, I Petrella and J F Rubio-Ramirez (2021), “Structural Scenario Analysis with SVARs”, Journal of Monetary Economics 117(C): 798-815.
Baumeister, C and J Hamilton (2019), “Structural Interpretation of Vector Autoregressions with Incomplete Identification: Revisiting the Role of Oil Supply and Demand Shocks”, American Economic Review 109(5): 1873-1910.
Boer, L, A Pescatori and M Stuermer (2021), “Energy Transition Metals”, IMF Working Paper 2021/243.
International Energy Agency (2021a), Net Zero by 2050. A Roadmap for the Global Energy Sector, International Energy Agency.
International Energy Agency (2021b), The Role of Critical Minerals in Clean Energy Transitions, World Energy Outlook Special Report. International Energy Agency.
International Monetary Fund (2021), Recovery During a Pandemic Health Concerns, Supply Disruptions, and Price Pressures, World Economic Outlook, October.
Jacks, D and M Stuermer (2020), “What Drives Commodity Booms and Busts?”, Energy Economics 85: 104035.
Kilian, L (2009), “Not all Oil Price Shocks are Alike: Disentangling Demand and Supply Shocks in the Crude Oil Market”, The American Economic Review 99(3): 1053-1069.
Pesaran, H H and Y Shin (1998), “Generalized Impulse Response Analysis in Linear Multivariate Models”, Economics Letters 58(1): 17-29.
Schwerhoff, G and M Stuermer (2015), “Non-renewable resources, extraction technology, and endogenous growth”, Dallas Fed Working Papers 1506, Federal Reserve Bank of Dallas.
Stuermer, M (2018), “150 Years of Boom and Bust: What Drives Mineral Commodity Prices?”, Macroeconomic Dynamics 22(3): 702-717.
World Bank (2020), Minerals for Climate Action: The Mineral Intensity of the Clean Energy Transition.


