Studying how firms respond to demand shocks can provide useful insights into firm and consumer behaviour, while revealing important implications for market outcomes and for policy decision making.
Firms can respond to shocks by adjusting prices (intensive margin) and/or their product mix (extensive margin). These decisions may potentially differ for single- versus multi-product firms, for premium-brand versus second-tier manufacturers, and for shocks that are temporary versus permanent; anticipated versus unanticipated; demand-driven versus supply-driven; and positive versus negative.
Understanding the multiple ways in which firms respond to shocks is not easy. While many studies have looked into each one of these potential responses in isolation and yielded valuable insights, less work has been done to document the multi-dimensional response of firms to shocks, and even less on the response of their competitors. For example, a literature focusing solely on the price response to seasonal (and therefore anticipated) demand variation finds that prices are often countercyclical (Chevalier et al. 2003, Nevo and Hatzitaskos 2006) and offers various competing explanations. Research on multi-product firms in international trade finds that adjustments at the extensive margin (change in sales attributed to entry and exit of new products) can be at least as important as changes in the intensive margin (change in sales attributed to goods that exist before and after) – see for example Bernard et al. (2011) and Broda and Weinstein (2010).
In a recent study, we aim to contribute to this work by using very rich micro-level (scanner) data to analyse firm responses to a consumer boycott (Antoniades and Clerides 2018). The natural experiment provided by boycotts is a source of exogenous variation that lends itself to the analysis of cause and effect, as in the recent work of Hendel et al. (2017). Our setting is unique in that the demand shock affects only a subset of the firms in the market. This fact, and the richness of our data, allow us to make a novel contribution by studying the response, both at the intensive and the extensive margins, of both the shocked firms and their competitors.
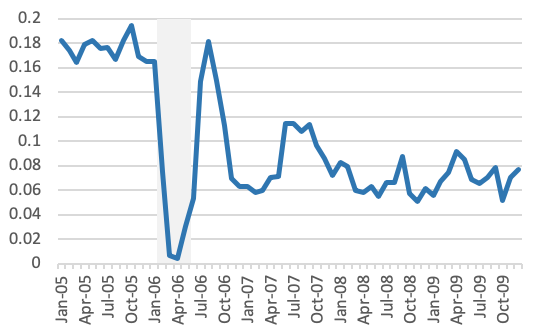
On 26 January 2006, imams in Saudi Arabia called for a boycott on Danish products during Friday prayers. The reason was the publication of 12 cartoons depicting the prophet Mohammad by Jyllands-Posten, Denmark’s largest newspaper, which caused outrage amongst Muslims. Within a week, the call for boycott had spread to more than ten Arab countries. Dairy products became a focal point of the boycott campaign and sales of Danish cheese firms in Saudi Arabia collapsed from 16.5% in January to below 1% during the boycott (Figure 1). The boycott was called off after four months, in late May 2006.
Figure 1 Market share of Danish cheese firms in Saudi Arabia
Source: Nielsen, authors’ calculations
The large, unanticipated shift in demand away from Danish products and towards non-Danish products provides a perfect setting for studying how firms respond to shocks. Our analysis revealed a notable difference in the response of Danish and non-Danish firms – Danish firms lowered prices moderately and kept the product mix the same after the boycott ended. On the other hand, non-Danish firms kept prices constant but altered the product mix substantially both during and after the boycott by introducing new varieties (barcodes) and new promotional bundles. In other words, we observed that the drop in Danish sales came solely from the intensive margin.
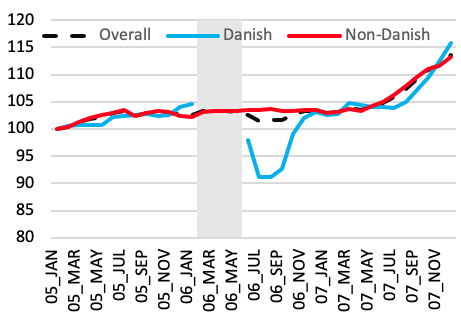
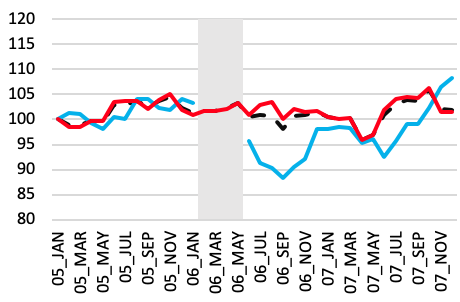
The price trends can be seen in Figure 2, which shows price indices for cheese products calculated in two different ways (varying and fixed weights). There is a decline in the price of Danish products of the order of 5–10% that lasts roughly a year, while there is no discernible change in prices of non-Danish products. The changes in sales are shown in Table 1—the loss of sales of Danish products comes from the intensive margin, while the increase in non-Danish sales from the extensive margin.
Figure 2 Price index for cheese products
(a) Varying weights as per sales in each month
(b) Fixed weights as per 2005 sales
Source: Nielsen, authors’ calculations.
Table 1 Decomposition of sales growth into intensive and extensive margin by brand type
Notes: the product is defined at the level of the barcode. The intensive margin of growth is defined as growth of products that exist in both periods over which the growth rate is calculated. The extensive margin of growth is defined as the growth in sales due to new products (creation) minus the loss in sales due to withdrawn products (destruction).
Given the substantial product entry we document in the response of non-Danish firms, we proceeded to examine in more detail the characteristics of these new varieties. Were they actually different products or just a repackaging of existing products into new promotional bundles? For the barcodes that represent new products, did the non-Danish brands choose to introduce products identical to the Danish product line (same package type, weight, and description) or did they introduce similar, but non-identical products? Following the convention in the marketing literature, we refer to the former as head-to-head competition and the latter as fill-in-the-blanks competition.
To test this, we first aggregated barcodes into product triplets of package type, weights, and variant (e.g. Glass Jar 240mg Low or Glass Jar 500mg Gold). In 2005, our sample included 550 cheese products (barcodes) that belonged to 105 distinct product triplets. We then grouped all product triplets that spanned the Danish cheese products in 2005 and called it the ‘Danish product space’. Finally, we checked how the number of cheese products in the Danish product space and outside of it grew between 2005 and 2007.
The results (Table 2) clearly suggest that non-Danish brands reacted to the boycott by introducing new products to compete head-to-head with Danish brands. In the Danish product space, between 2005 and 2007 varieties grew from 152 to 202, while in the non-Danish space they actually fell. This is particularly interesting if one takes into account the fact that the Danish product space in 2005 was already congested (152 products in just 24 product triplets) relative to the non-Danish (176 in 81).
Table 2 Orientation of new products
Finally, when looking at these new barcodes more closely, we found evidence that while a significant number of them represented new promotional bundles of existing products – especially immediately after the end of the boycott – the vast majority represented genuinely new products.
Our main findings from this study – that Danish firms adjusted to an unanticipated decrease in demand through the intensive margin, and that non-Danish firms adjusted to an unanticipated increase through the extensive margin – is perhaps hard to reconcile with existing pricing theories, or theories on multi-product firms. Such theories would predict that the adjustment happens at the same margin (either intensive or extensive, but in opposite direction for these two types of firms). Partly, this is due to the particular nature of the case study that cannot be easily generalised to other settings. But there are a couple of interesting interpretations of our results that encourage further consideration and study. First, there may be a significant difference in how firms perceive shocks of opposite signs. While negatively affected firms lower their prices in an effort to defend their market share, positively shocked firms are reluctant to raise prices, possibly in order to avoid being seen as exploiting consumer sentiments. Second, it may be the case that securing shelve space in retailers is very costly, and once these sunk costs are incurred by brands, brands have less of an incentive to drop products in bad times than to introduce new ones in good times (where these fixed costs may conceivably be lower).
Authors’ note: This research was made possible by support of an NPRP grant from the Qatar National Research Fund. The statements made herein are solely the responsibility of the authors.
References
Antoniades, A and S Clerides (2018), “Micro-responses to shocks: Pricing, promotion, and entry,” CEPR Discussion Paper 13281.
Bernard, A B, S J Redding and P K Schott (2011), "Multiproduct firms and trade liberalization," Quarterly Journal of Economics 126(3): 1271–1318.
Broda, C and D E Weinstein (2010), "Product creation and destruction: Evidence and price implications," American Economic Review 100(3): 691–723.
Chevalier, J A, A K Kashyap and P E Rossi (2003), "Why don't prices rise during periods of peak demand? Evidence from scanner data," American Economic Review 93(1): 15–37.
Hendel, I, S Lach and Y Spiegel (2017), "Consumers' activism: The cottage cheese boycott," RAND Journal of Economics 48(4): 972–1003.
Nevo, A and K Hatzitaskos (2006), “Why does the average price of tuna fall during Lent?” NBER, Working Paper 11572.
Warner, E J and R B Barsky (1995), "The timing and magnitude of retail store markdowns: Evidence from weekends and holidays," Quarterly Journal of Economics 110(2): 321–352.


