How happy do you feel today and how old are you? Do you believe in the midlife crisis of folklore, the life-cycle theory of economics, or any other specific theory about what happens to humans as they go greyer?
Nearly two decades ago, a review article by Diener et al. (1999) concluded that happiness and psychological wellbeing are essentially independent of age. They illustrated that view with a flat line (in Figure 3 of their paper). To our knowledge, most textbooks in social psychology continue to teach students the same idea.
How should this topic be tackled by economists and quantitative social scientists? One method is to use cross-sectional datasets. This is a ‘snapshot’ approach (to use the term adopted in Stone et al. 2010). It has some advantages, including simplicity and the ability to examine large cross-national samples. It has the disadvantages that it may be subject to year-of-birth cohort effects and that, more broadly, the statistical information about ageing then comes from cross-person rather that within-person observation. Of course, any cohort effects are themselves, in principle, of scientific interest.
Do we have a tendency to a midlife low?
In a recent paper, we argue that the traditional Diener et al. (1999) conclusion that wellbeing is flat through life does not do justice to current evidence (Blanchflower and Oswald 2017). We believe that humans have a fundamental tendency to a midlife low. If you have an economics PhD and have ever estimated a ‘happiness equation’ with micro data, you probably think the same. But the idea is still not fully known among economists.
Our paper examines data on 1.3 million randomly sampled individuals across a large number of nations. The paper is methodologically very simple. We bring together seven datasets, treat them in a consistent way, and simply plot the results. We argue that it is natural for researchers to try to understand the patterns in pooled cross-sectional datasets as well as those in longitudinal datasets. This certainly does not mean that we think cross-sectional data are better – just that they offer part of the evidence with which social scientists should presumably work.
The background literature is now large. It is also, currently, rather disputatious (including, but not limited to, Blanchflower and Oswald 2008, Easterlin 2003, 2006, Frey and Stutzer 2002, Freund and Ritter 2009, Frijters and Beaton 2012, Glenn 2009, Graham and Pozuelo 2017, Lachman 2015, Stone et al. 2010, Steptoe et al. 2015, Van Landeghem 2012, Wunder et al. 2013, Schwandt 2016). In an unusual paper that is related to this literature, Weiss et al. (2012) use data on three samples of great apes and document some evidence of a U-shape.
Other studies, such as Lachman (2015), come close to arguing that there may be a midlife dip but that it may be too small to be significant. Some writings (e.g. Freund and Ritter 2009) are fairly dismissive of the notion of a midlife low. Plenty of material on the internet goes further and derides the entire idea of a midlife crisis.
Within the cross-section tradition, two broad ways to analyse the paper’s scientific issue can be found. One set of writings has attempted to study raw numbers on well-being and age. This might be called the descriptive approach. A second has examined the patterns in regression equations for well-being (that is, adjusting for other influences). This might be termed the ceteris paribus analytical approach. Methods of the latter kind are standard in epidemiology and economics, of course, where the tradition has been to try to understand the consequences of an independent variable (smoking, income, etc.) after adjusting for other influences on the dependent variable.
Neither of these two approaches is ‘right’. They measure different things.
The U-shape of life satisfaction
Our paper’s seven datasets provide information on large numbers of randomly sampled citizens; each person is asked questions about happiness or life satisfaction. The datasets are, respectively, for the UK, the US, 36 European countries, 32 European countries, 51 nations around the world, and (again) the US.
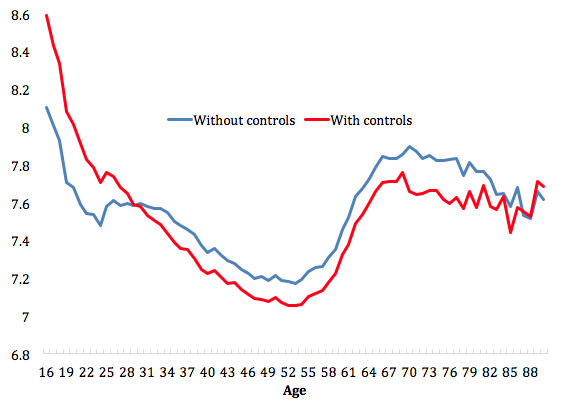
For example, Figure 1 plots life-satisfaction data for approximately 416,000 randomly sampled citizens of the UK. Wellbeing data are now collected annually as part of official government statistics by the UK Office for National Statistics (ONS). One of those is a measure of citizens’ overall life satisfaction.1
Figure 1 Life satisfaction at different ages in the UK, 2011-2015 pooled (416,000 observations)
Notes: This figure is based on data using the question “Overall, how satisfied are you with your life nowadays?” scored from zero to 10. To aid in understanding the size of the age effect, the coefficients on marital separation and unemployment in a life-satisfaction regression equation here are approximately -0.3 and -0.8. The figure is constructed by estimating a regression equation with approximately 74 separate age dummy variables.
Figure 1, and each of the later figures in our paper, lays out two kinds of plots. One is for raw averaged life-satisfaction scores at different ages. This is the descriptive approach, advocated by, for example, Glenn (2009). The other, derived from a regression equation in which other covariates (so-called ‘controls’) are included, is the regression-adjusted level of life satisfaction. This can be thought of as an estimate of the pure or ‘marginal’ effect of ageing. It can be seen in the figure that the two curves are similar to one another, so in this case the adjustment for controls does not greatly affect the fundamental conclusions.
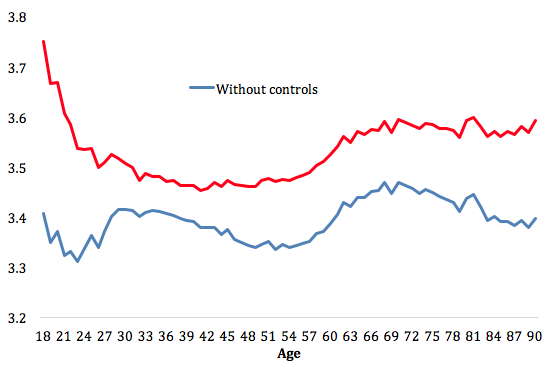
Figure 2 plots life-satisfaction data for approximately 427,000 randomly sampled citizens of the US. The data are from the Behavioral Factor Surveillance System (BRFSS), which is a survey run by the US Centres for Disease Control.2 The data are for 2010, which is the most recent year in which the BRFSS asked this question.
Figure 2 Life satisfaction at different ages in the US, 2010 (427,000 observations)
Notes: This figure is based on data using the question “In general, how satisfied are you with your life? Very dissatisfied,…., very satisfied.” scored from 1 to 4. To aid in understanding the size of the age effect, the coefficients on marital separation and unemployment in a life-satisfaction regression equation here are approximately -0.3 and –0.3.
As before, the figure lays out two kinds of plots. One is for raw averaged life-satisfaction scores at different ages. The other, derived from a regression equation in which other covariates (so-called ‘controls’) are included, is the regression-adjusted level of life satisfaction. It can be seen, as in Figure 1 for UK data, that the two curves in Figure 2 have some similarities to one another. There is apparently some form of midlife low, although now the adjusted nadir (that is, with controls) is closer to early-40s rather than approximately 50. However, the pattern across all ages in the no-controls case is more ‘wavy’ with an early dip at the start of people’s 20s. Adjusted wellbeing in the US starts high in youth and declines smoothly until the flat part in middle age; it then rises in hill-like way to approximately the age of 70; after that it runs roughly flat, or even fractionally up, until the age of 90.
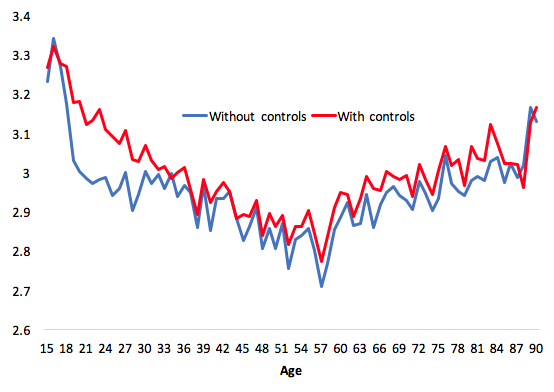
Figure 3 plots life-satisfaction data for approximately 32,000 randomly sampled citizens across a pooled set of 36 Europeans. The data are from the Eurobarometer Survey series.3 Figure 3 has the previous form of double plot. One is for raw averaged life-satisfaction scores at different ages. The other is the regression-adjusted level of life satisfaction. As in Figure 1 for the UK, and to lesser extent Figure 2 for the US, the two curves track each other. Thus, as before, in this case the adjustment for controls does not alter the fundamental result.
Figure 3 Life satisfaction at different ages in 36 European countries, 2016 (32,000 observations)
Notes: This figure is based on data using the question “On the whole, are you very satisfied, fairly satisfied, not very satisfied,or not at all satisfied with the life you lead ?” scored from 1 to 4. To aid in understanding the size of the age effect, the coefficients on marital separation and unemployment in a life-satisfaction regression equation here are approximately -0.2 and -0.3.
What comes out of Figure 3 is a pattern very like the one in Figure 1. Wellbeing starts high in youth and falls in a fairly linear way to approximately the mid-50s; as an underlying trend, it then rises in a roughly linear way up to approximately the age of 90. The controls in this case are country dummy variables, gender, level of education, marital status, labour market status, and year dummies.
It might be argued that longitudinal data are, in principle, the desirable kind of testbed. We are sympathetic to that view. However, there is a correction for cohort effects in an earlier paper of ours (Blanchflower and Oswald 2008), and there are emerging panel results, such as Cheng et al. (2017), in which in four longitudinal data sets a U-shape is found. Perhaps the most effective longitudinal evidence against a midlife low is the potentially important work of Galambos et al. (2015) on some fairly small Canadian data sets. It is not currently possible to know why the limited number of modern longitudinal studies do not all agree with one another.
We find in our paper that five out of our seven datasets show a midlife low in raw data. All seven show a midlife low in regression-corrected data. The datasets are publicly available and these results are thus checkable.
Concluding remarks
Overall, we think there is a great deal of evidence – though we have critics, especially among a small group of social psychologists – that humans experience a midlife psychological ‘low’. The midlife decline in wellbeing is apparently substantial and not minor (see the notes below each figure, which compare to the coefficients on major life events). It should perhaps be emphasised that the midlife low is not affected by regression-equation controls for having young children, nor by changing the exact nature of the dependent variable.
Our view is that these kinds of plots of happiness and life satisfaction should be shown – admittedly with a discussion of appropriate caveats – to all young psychologists and economists and medical scientists and biologists and others. The phenomenon seems an important and fundamental one. It is currently a puzzle. Realistically, nobody in the world understands why these intriguing U-shapes are found in modern data. Ignoring the existence of this apparently deep-rooted pattern, however, is presumably not helpful or scientifically sensible.
References
Blanchflower, D G and A J Oswald (2008), “Is well-being U-shaped over the life cycle?", Social Science and Medicine 66: 1733-1749.
Blanchflower, D G and A J Oswald (2017), “Do humans suffer a psychological low in midlife? Two approaches (with and without controls) in seven data sets”, NBER Working Paper 23724.
Carstensen, L L, B Turan, S Scheibe, R Ram, H Ersnser-Hershfield, G R Samanez-Larkin, K P Brooks and J R Nesselroade (2011), “Emotional experience improves with age: Evidence based on over 10 years of experience sampling”, Psychology and Aging 26: 21-33.
Cheng, T, N Powdthavee and A J Oswald (2017), “Longitudinal evidence for a midlife nadir: Result from four data sets”, Economic Journal 127: 126-142.
Diener, E, E M Suh, R E Lucas and H L Smith (1999), “Subjective well-being: Three decades of progress”, Psychological Bulletin 125(2): 276-302.
Easterlin, R A (2003), "Explaining happiness", Proceedings of the National Academy of Sciences 100: 11176-11183.
Easterlin, R A (2006), “Life cycle happiness and its sources: Intersections of psychology, economics and demography”, Journal of Economic Psychology 27: 463-482.
Freund, A M and J O Ritter (2009), “Midlife crisis: A debate”, Gerontology 55: 582-591.
Frey, B S and A Stutzer (2002), Happiness and economics, Princeton: Princeton University Press.
Frijters, P and T Beaton (2012), “The mystery of the U-shaped relationship between happiness and age”, Journal of Economic Behavior and Organization 82: 525-542.
Galambos, N L, S Fang, H J Krahn, M D, Johnson and M E Lachman (2015), “Up, not down: The age curve in happiness from early adulthood to midlife in two longitudinal studies”, Developmental Psychology 51: 1664-1671.
Glenn, N D (2009), “Is the apparent U-shape of well-being over the life course a result of inappropriate use of control variables? A commentary on Blanchflower and Oswald”, Social Science and Medicine 69: 481-485.
Graham, C and J R Pozuelo (2017), “Happiness, stress, and age: How the U curve varies across people and places”, Journal of Population Economics 30: 225-264.
Lachman, M E (2015), “Mind the gap in the middle: A call to study midlife”, Research in Human Development 12: 327-334.
Schwandt, H (2016), “Unmet aspirations as an explanation for the age U-shape in well-being”, Journal of Economic Behavior and Organization 122: 75-87.
Steptoe, A, A Deaton and A A Stone (2015), “Subjective wellbeing, health, and ageing”, Lancet 385: 640–648.
Stone, A A, J E Schwartz, J E Broderick and A Deaton (2010), “A snapshot of the age distribution of psychological well-being in the United States”, Proceedings of the National Academy of Sciences of the USA 107: 9985–9990.
Van Landeghem, B (2012), “A test for the convexity of human well-being over the life cycle: Longitudinal evidence from a 20-year panel”, Journal of Economic Behaviour and Organisation 81: 571-582.
Weiss, A, J E King, M Inoue-Murayam, T Matsuzama and A J Oswald (2012), “Evidence for a midlife crisis in great apes consistent with the U-shape in human well-being”, Proceedings of the National Academy of Sciences of the USA 109: 19949-19952.
Wunder, C, A Wiencierz, J Schwarze and H Küchenhoff (2013), “Well-being over the life span: Semiparametric evidence from British and German longitudinal data”, Review of Economics and Statistics 95: 154-167.
Endnotes
[1] The details and sampling methods are discussed at www.ons.gov.uk/well-being.
[2] Available at www.cds.gov/brfss
[3] Available at www.ec.europa.eu


