Non-linear incentive systems that pay workers bonuses for meeting a production or sales target are widely used for sales workers (The Wilson Group 2017) and also used in manufacturing because of their impact on worker productivity. Pay someone extra for attaining a target and they often try harder and succeed in meeting the target. Workers can also, however, game a non-linear incentive system (Oyer 1998, Tzioumis and Gee 2013, Larkin 2014), reducing long-term profits. A salesperson can, for instance, lower a price or make exaggerated claims to customers to close deals and make a target while costing the firm profits per sale or future sales. Workers rewarded for producing numbers of units may pay little attention to quality, harming the firm’s reputation and producing many returns and complaints. Firms must balance the gaming costs of non-linear incentives against the benefits of increased sales or outputs.
Our research (Freeman et al. 2019) on the introduction of a high-powered non-linear incentive system for insurance agents by a major Chinese insurance firm found that steep non-linear incentives increased agent productivity and lowered turnover rates sufficiently to outweigh the gaming costs and benefit both workers and the firm. Comparing the distribution of outputs and earnings bunched around targets after the new system was introduced to before it was introduced reveals a huge supply response by workers that can be seen readily in the data and that far overwhelmed the costs of gaming the system. The question is not whether firms and workers benefited from high-powered non-linear incentives, but why the firm did not ramp up incentives earlier.
The firm and its new incentive system
Our testing ground is the largest branch of a top Chinese insurance firm (“the firm” hereafter). Between January 2013 and December 2016, the firm made 153 million yuan in insurance premiums and employed more than 20,000 sales agents. Agents have zero base salary and earn income from insurance commissions and bonuses and exhibit high turnover, particularly for newly hired agents.
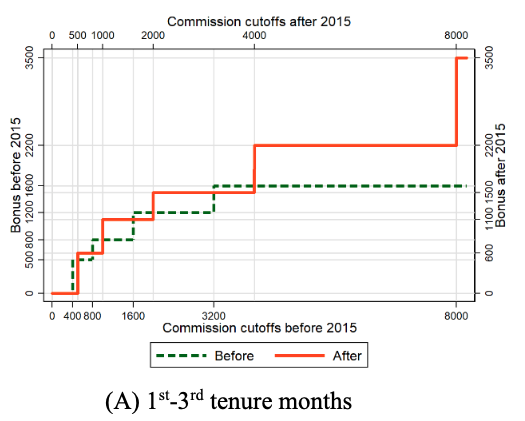
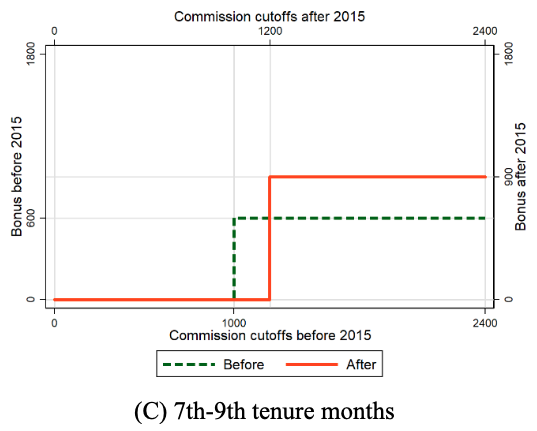
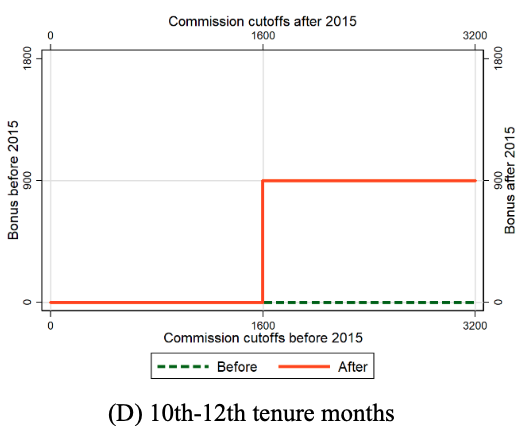
On 1 January 2015, the firm raised thresholds and bonuses and extended the period of the non-linear incentives for selling insurance to newly recruited agents. Figure 1 shows that the new compensation system dominated the previous system at different target levels. The new plan covered newly hired workers in the 10th-12th month of tenure who had not been covered by the previous incentive system.
Figure 1 Compensation systems for the newly hired agents
Source: Freeman et al. (2019).
Productivity effect
If agents respond to the threshold incentives, the distribution of output should be bunched around the new threshold in the after period and the old threshold in the before period. Figure 2 shows that is indeed what happened for workers with one to three tenure months, with the bunching jumping from just above the 400 yuan target under the old system to the 500 yuan commission threshold of the new system. We observe similar patterns for workers with higher levels of tenure. No high-powered econometrics are needed to see the response of agents to incentives.
Figure 2 Distribution of life insurance commissions around the commission thresholds in the 1st-3rd tenure months
Source: Freeman et al. (2019).
Figure 3 compares life insurance commissions (which depend directly on productivity) between the workers with 1st-12th tenure months covered by the new system to the commissions of experienced workers with 13th-18th tenure months whose compensation system did not change over time. For simplicity, the figure normalises the commission level at the amount paid to the 13th-18th month tenure group before the change as zero. Before the January 2015 change, the coefficients for the covered and control groups were both in the zero range. After the change, the commissions of the newly hired agents whose incentives were raised increased sharply and remained consistently high. By contrast, the commissions of experienced agents whose incentive pay did not change remained essentially constant. The sharp jump in the first month and continued high level of commissions earned by those covered by the new incentive systems suggests that agents quickly figured out how to raise sales to meet the new targets and then kept doing what worked thereafter.
Figure 3 Estimated dynamic effect on the life insurance commissions
Source: Freeman et al. (2019).
Based on our estimates, the new compensation plan increased life insurance sales for different groups by a minimum of 39% for workers in the first three months of employment to a maximum of 54% for the 10th-12th month tenure workers who had not previously been included in the incentive system. Their behaviour reflects moving from a no-incentive system to a non-linear incentive system, whereas the other workers were responding to a change in non-linear incentives.
Agent welfare improvement
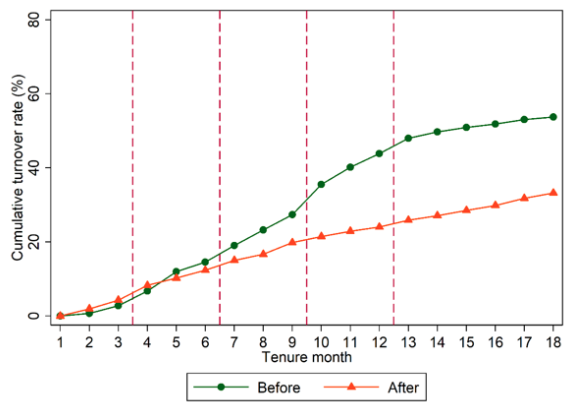
The increased in agents’ income does not translate simply into comparable improvements in their net well-being. Much of the increase in income could have come at the expense of longer and more stressful work hours, offsetting in part the higher incomes (Bryson et al. 2012). Absent reports on job satisfaction from agents, we use firm data on turnover to assess the net welfare benefit to agents from the new system. If agents ‘paid’ for the higher performance through more stressful work, some would likely have found the job no longer attractive and have left more quickly than under the previous incentive system. Those who stayed would also have paid a price for their higher income, though its benefits presumably exceeded the cost. If, on the other hand, the income gains from the new system dominated the cost of greater time and effort to attain targets, the job would have become more attractive, reducing turnover.
Figure 4 shows that turnover fell sharply for agents fully covered by the new compensation system compared to those covered by the old compensation. The implication is that the higher income under the new system made working for the firm more attractive relative to whatever the increase in worker stress.
Figure 4 Cumulative turnover rate (%) against tenure months
Source: Freeman et al. (2019).
Gaming the changes and firm profits
As noted, high-powered non-linear incentives can induce workers to game the system and possibly allocate their time and effort in ways that harm firm profits. Workers in the firm reduced sales of insurance products not covered by the incentive system by about 10% of the increase in commissioned sales due to the new incentive system. The firm lost about 25% of the increased sales of insurance because customers failed to meet the health conditions required by the firm. But while these deductions are sizeable, the firms’ net income still rose substantially. Back-of-the-envelope calculations that take account of all the effects of the new system on worker and firm earnings suggest that 63% of the total return from the new non-linear system went to the firm.
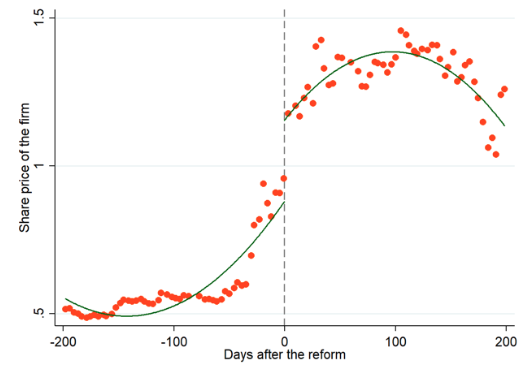
As an alternative way to assess the value of the new incentives on the firm, we compared the share price of the firm before the introduction date of the new plan to the share price after the introduction date. Figure 5 shows a marked jump in share price (scaled to be 1 on the day of the change to better preserve the identity of the firm) in the narrow interval surrounding the introduction of the new policy. The magnitude of the jump suggests the market valued the new system as improving net future revenues at 10-15% of the value of the firm.
Figure 5 Share price of the firm around the introduction date
Source: Freeman et al.(2019).
Conclusion
In sum, steepened non-linear incentives induced large supply responses from agents in the firm we studied. The responses justified the firms’ decision to bring in the new compensation system and produced sufficiently higher earnings for workers to reduce turnover. The large gains from the new system raise a follow-up question about why the firm did not increase incentives earlier than it did that goes beyond our data.
References
Bryson, A, E Barth, and H Dale-Olsen (2012), “Do Higher Wages Come at a Price?”, Journal of Economic Psychology 33(1): 251-263.
Freeman, R B, W Huang, and T Li (2019), “Non-linear Incentives and Worker Productivity and Earnings: Evidence from a Quasi-experiment.” NBER Working Paper No. 25507.
Larkin, I (2014), “The Cost of High-powered Incentives: Employee Gaming in Enterprise Software Sales”, Journal of Labor Economics 32(2): 199-227.
Oyer, P (1998), “Fiscal Year Ends and Nonlinear Incentive Contracts: The Effect on Business Seasonality”, The Quarterly Journal of Economics 113(1): 149-185.
The Willis Group (2017), Wilson Group 2017-2018 Sales Compensation Practices Survey Report, study authored by Tom Wilson, Susan Malanowski, Rhonda Farrington, and Lisa Nivison.
Tzioumis, K, and M Gee (2013), “Nonlinear Incentives and Mortgage Officers’ Decisions”, Journal of Financial Economics 107(2): 436-453.


