Between February 2015 and February 2016, Sweden’s central bank, the Sveriges Riksbank, cut the policy rate (or ‘repo rate’) to below zero (see Table 1) and initiated a programme of government bond purchases to combat persistently low inflation. The Riksbank expected that some channels of monetary policy transmission would work as normal, including the exchange-rate channel, whereas the bank lending channel might be impeded by a possible lower bound on bank deposit rates.1
More recently, some authors have formalised the idea that bank lending rates may respond more weakly to interest rate cuts when the policy rate passes below a certain level. Contributions include those by Brunnermeier and Koby (2018) and Eggertsson et. al. (2017, 2018, 2019). The three papers by Eggertsson et al. expand on the deposit floor argument. They conclude that it can even be contractionary to lower policy rates further once the deposit floor has been reached.
This column comments on the Swedish experience and argues that the pass-through of policy rate cuts below zero to the economy has been reasonably good and that hence, the overall picture is that monetary policy has been effective even at negative policy rate levels, to some degree in contrast to the findings in Eggertsson et al. (2019).
Table 1 The Riksbank policy rate and decision dates
Pass-through to market interest rates
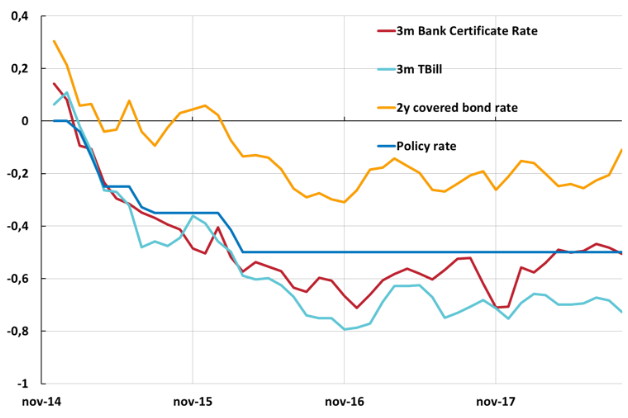
The Riksbanks expectation that some transmission channels would work more or less as normal at negative policy rates was partly based on the presumption that there would be a good pass-through to market-based interest rates, for example to securities issued and traded in the capital markets. Figure 1 plots selected interest rates together with the Riksbank policy rate from November 2014, when the policy rate was zero.2 It is evident that the pass-through to these rates indeed was strong even when the policy rate became negative.3 The trade-weighted exchange rate depreciated around 4% following the announcement in December 2014 that the Riksbank was considering introducing negative interest rates and other measures. Lower interest rates in the capital markets also lowered the funding costs for firms and banks.4 Thus, part of the funding costs for banks have declined with the policy rate even when some deposit rates have effectively been bounded by zero.5
Figure 1 Market rates and the policy rate
Source: The Riksbank, Macrobond.
The extent to which banks’ lending rates to households and firms decline as a result of policy rate cuts could depend, among other things, on how readily these customers can switch to alternative funding sources, such as direct borrowing in the capital market or borrowing from other institutions with a high degree of funding coming from bond issuance. In the next section we look empirically at whether bank lending rates have followed the policy rate.
Pass-through to non-financial firms and households
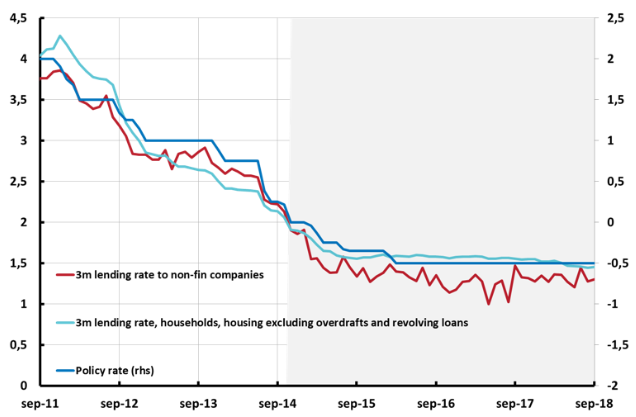
Figure 2 shows how the policy rate and monetary financial institutions’ (MFIs) actual three-month lending rates to households and firms have developed since the policy rate peaked in 2011.6 The motives for illustrating the three-month fixation period is twofold. First, a large majority of all mortgages are contracted at three-month fixation periods.7 Second, the three -month interest rate should move in line with the actual policy rate while rates with longer fixation periods should, to a larger extent, reflect future policy rates.
The figure indicates that shifts in lending rates do not always occur contemporaneously with shifts in the policy rate.8 However, over time, the pass-through from the policy rate to lending rates seems to be, more or less, one-to-one even in a negative policy rate environment.
Figure 2 Policy rates and MFI lending rates, new and renegotiated loans
Source: Riksbank, Statistics Sweden
Note: Shaded area starts in November 2014, three months before the first negative policy rate cut. “Overdrafts and revolving loans” mainly consists of loans for renovating and building new homes.9 3m refers to all loans with a fixation period of up to three months.
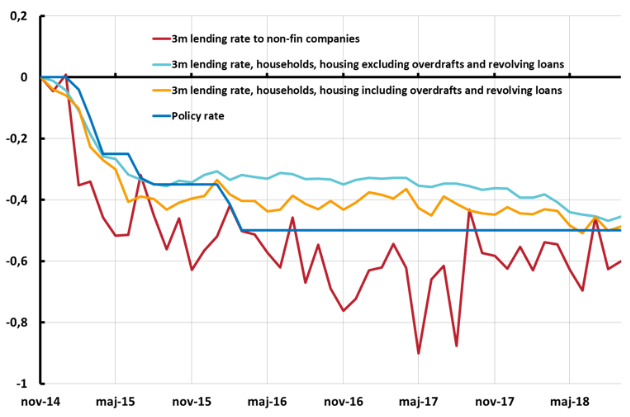
Let us now examine more closely the period starting just before the introduction of negative policy rates to the end of 2018. Since lending rates and policy rates differ in levels, Figure 3 plots the change in these rates since November 2014.10
Figure 3 Change of interest rates on new and renegotiated loans since November 2014
Source: The Riksbank, Statistics Sweden
Note: “Overdrafts and revolving loans” mainly consists of loans for renovating and building new homes. 3m refers to all loans with a fixation period of up to three months.
The three-month lending rate11 to firms is volatile, but Figure 3 shows that the cumulated decline in MFI lending rates to firms indicates full pass-through. One reason could be that firms, to a great extent, view direct funding in the capital markets as an alternative and competitive funding source.
As is clear from Figure 3, the last rate cuts had limited initial pass-through on the lending rates to households, as expected by the Riksbank and emphasised by Eggertsson et. al. (2019). Over time, however, transacted three-month mortgage rates continued to decline and pass-through was more or less complete by mid-2018.12 One possible interpretation behind the more gradual pass-through of the last two cuts is that the established banks initially tried to exploit their market power and resist further interest rate cuts. But this strategy was not sustainable as new entrants and some established banks, more reliant on market-based funding, started to offer lower mortgage interest rates to households, forcing other banks to gradually cut their lending rates.13
In Figure 3 we have plotted the interest rates for housing loans, with and without “overdrafts and revolving loans”, which is a series mainly consisting of loans for renovating and building new homes. The results are similar, but we note that a discrepancy of around 10 basis points can easily arise depending on which series we choose to look at.
As motivated above, we believe that the pass through from policy rates to lending rates is best illustrated with three-month rates. However, for the sake of completeness, in Figure 4 we plot the weighted average of all lending rates. This data does not alter our conclusions.14 We also include the series lending to households, all accounts, which includes consumption loans. This is a further indication of the uncertainty surrounding the actual pass-through of changes in the policy rate, as it is unclear which of these series that represent the most relevant measure.
Figure 4 Change of interest rates on new and renegotiated loans since November 2014
Source: The Riksbank, Statistics Sweden.
Note: “Overdrafts and revolving loans” mainly consists of loans for renovating and building new homes.
Conclusions
To sum up, negative policy rates seem to have had a strong and immediate pass-through to bond market yields and lending rates to firms. Pass-through appears to have been somewhat slower and weaker for lending rates to households, but that depends partly on which data we look at. The implication is that several transmission channels – for example, channels working through capital market interest rates and therefore the exchange rate – were fully active at negative rates. While the bank lending channel might have been slightly muted for households, our conclusion is that negative interest rates have successfully contributed to more expansionary monetary policy. Of course, we cannot exclude that further cuts of the policy rate would have been associated with a weaker pass-through induced by the channel that Eggertsson et. al. (2019) emphasise.
Authors’ note: The authors are grateful for discussions and input provided by Kimberly Doherty, Jesper Hansson, Jesper Lindé, Jens Iversen, John Svanäng, Lars EO Svensson, Ulf Söderström, Emre Ünlü and Meredith Beechey Österholm. The views in this column are those of the authors and do not necessarily correspond to those of the Riksbank.
References
Alsterlind, J, H Armelius, D Forsman, B Jönsson and A Wretman (2015), “How Far Can the Repo Rate be Cut?”, Economic Commentary No. 11, Sveriges Riksbank.
Brunnermeier, M and Y Koby (2018), “The Reversal Rate”, mimeo, Princeton University.
Eggertsson, G, R Juelsrud and E Wold (2017), “Are Negative Nominal Interest Rates Expansionary?”, NBER Working Paper 24039.
Eggertsson, G, R Juelsrud and E Wold (2018), “Monetary policy with negative nominal interest rates”, VoxEU.org, 31 January.
Eggertsson, J, R Juelsrud, L Summers and E Wold (2019). “Negative Nominal Interest Rates and the Bank Lending Channel”, NBER Working Paper 25416.
Flodén, M, M Kilström, J Sigurdsson and R Vestman (2017), “Household Debt and Monetary Policy: Revealing the Cash-Flow Channel”, CEPR Discussion Paper 12270.
Sveriges Riksbank (2015), Monetary Policy Report, February.
Endnotes
[1] See Sveriges Riksbank (2015: 41): “Now that the repo rate is being cut to −0.10 per cent, the banks can of course choose not to introduce negative deposit rates. The banks can then instead retain their earnings by not cutting lending rates to the same extent as usual when the repo rate is cut. This could mean that the monetary policy transmission mechanism may become somewhat weaker than normal, when the repo rate is cut below zero.” See also Alsterlind et al. (2015).
[2] The Riksbank cut the policy rate to zero in October 2014. One motive for presenting the monthly data in the chart from November 2014 is that this change was then effective and thus behind us. Also, the first negative policy rate was effective from February 18 2015 when the policy rate was lowered in a small step, 10 basis points. Assuming agents have perfect foresight, average three-month rates in November 2014 should only to a small extent be affected by the forthcoming negative rates. Thus, when illustrating the development of interest rates when the policy rate was cut from zero to ‑0.5, November 2014 seems to be the best starting date.
[3] During the time span of negative interest rates, the Riksbank also purchased government bonds. Thus, these purchases may also have contributed to the low government TBill rates.
[4] A non-negligible and increasing part of the loan stock of companies consists of issued securities. Between January 2013 and June 2018, non-financial firms increased the loan volumes borrowed from banks by SEK 428 billion. During the same time span, the outstanding volume of issued securities from these firms, increased SEK 591 billion.
[5] Not all deposits are constrained by a zero bound. In general, households do not meet a negative deposit rate while many non-financial companies and most financial institutions meet negative interest rates on their deposits.
[6] These are compiled by Statistics Sweden based on all actual transactions. Throughout this article, 3m refers to fixation periods of three month or less.
[7] Between January and October 2018, 77% of all new mortgage loans had variable (3-month) rate according to Statistics Sweden. Flodén et. al. (2017) discuss the implication this has for the strength of the cash-flow channel for indebted households.
[8] The first policy rate cut occurred in December 2011. Since the data in Chart 2 starts in September 2011, forward looking agents should not yet have altered 3 month lending rates much. In the chart, the policy rate is depicted on the right axis and 3 month lending rates on the left. Please note though that the distance in basis points between the tick marks on the left axis is the same as on the right axis.
[9] In Statistics Sweden’s terminology, overdrafts and revolving loans are termed “transaction accounts etc.”.
[10] Please consult endnote 2 for a motivation of November 2014 as starting date for the charts.
[11] Of the MFI corporate lending stock, 65% were initiated with a three-month fixation period. The short duration in the corporate lending stock motivates our use of the three-month rates, also for firms, in our illustration of the pass-through.
[12] In December 2018, the Riksbank decided to hike the policy rate from ‑0,5 to ‑0,25 effective from January 09, 2019. The last observation in Figure 2 is the average level of the policy rate and the three-month lending rates during September 2018.
[13] Another possible explanation is that regulatory measures, including amortisation requirements, have reduced the amount of funding provided to weaker customers, leading to a decline in the average mortgage rate customers pay since stronger customers receive higher discounts from the listed rates.
[14] We can note that household loans, other than mortgage loans, seems to have fallen more when not only 3 month fixation periods are included. One reason could be that many consumption and transaction accounts are on other maturities, actually sometimes on a daily basis.


