According to the textbook Phillips curve, a weak economy pushes inflation down and a strong economy pushes it up. This does not match Europe’s experience of the last 12 years. Inflation did not fall as much as the Phillips curve predicted in the recessions of 2008 and 2011, and it has not risen as much as the theory predicted in the economic recovery. Many researchers have explored the puzzles of Europe’s 'missing disinflation' and 'missing inflation' (e.g. Ciccarelli and Osbat 2017, Bobeica and Sokol 2019).
In recent research (Ball and Mazumder 2020), we argue that this is not as puzzling as many economists suggest. If we focus on a measure of core inflation that strips out transitory shocks to headline inflation, the simple Phillips curve captures most of the movement in inflation in the two decades that the euro has existed.
Measuring core inflation
Large changes in relative prices make the headline inflation rate volatile. Researchers try to isolate a more stable level of underlying or core inflation that the Phillips curve can explain, and we have done the same, but using a different measure of core inflation.
The most common measure is the inflation rate after excluding large price changes in food and energy. But many other industries also experience large price changes that affect headline inflation. So, instead, we use a core-inflation measure proposed by Bryan and Cecchetti (1994), namely, the weighted median of industry inflation rates. The weighted median filters out large shocks in all industries, which makes it less noisy and easier to explain than the conventional core measure.
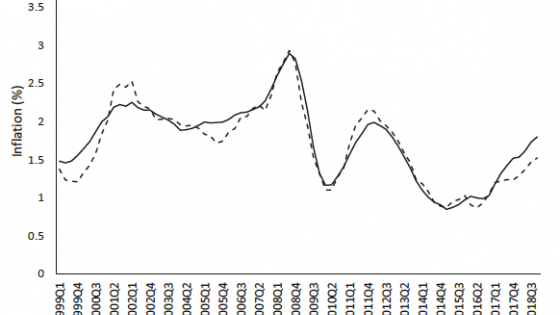
Figure 1 compares the behaviour of headline inflation in the euro area and weighted-median inflation, between 1999 and 2018. The weighted median is considerably less volatile, especially after 2008.
Figure 1 Headline inflation and median inflation in the euro area, 1999-2018
Source: Ball and Mazumder (2020).
A simple Phillips curve
We seek to explain this median inflation with a simple version of Milton Friedman’s (1968) Phillips curve. Friedman argued that the inflation rate depends on two variables: expected inflation and the level of slack in the economy. We measure expected inflation using long-term forecasts from the European Survey of Professional Forecasters, and we measure slack as the gap between output and potential output. We use estimates of potential output from the OECD.
In our data, expected inflation is quite stable: it lies in a range from 1.8% to 2.0% throughout the sample period. In practice this means that our Phillips curve is close to one in which the output gap is the only variable explaining the movement of core inflation. The only unknown parameter in the specification is the coefficient on the gap – the slope of the Phillips curve.
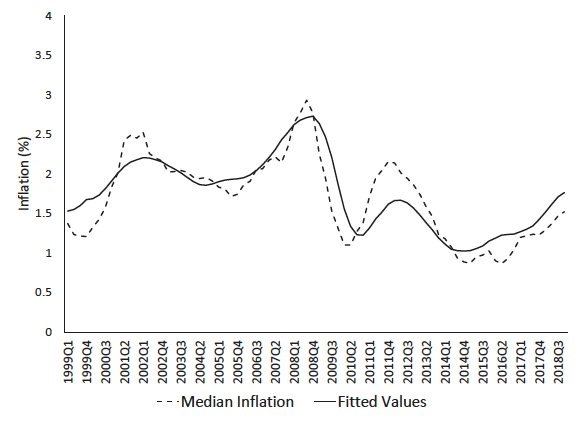
We use quarterly data to estimate the output-gap coefficient, construct the fitted values of median inflation implied by our Phillips curve, and compare these fitted values to actual median inflation. Figure 2 shows the comparison of actual and fitted inflation rates.
Figure 2 The fit of a simple Phillips curve for the euro area, 1999-2018
Source: Ball and Mazumder (2020).
Our simple Phillips curve captures much of the behaviour of median inflation. Like actual median inflation, the fitted values from our specification trend upwards during the euro’s first decade, fall after the recession of 2008, fall again after the recession of 2011, and rise during the economic recovery since 2014.
However, the fit of our Phillips curve is far from perfect. The specification does not explain the rise in the median inflation rate in 2010 and 2011 well. Also, after 2014, the actual inflation rate is persistently lower than the fitted values, even though it is rising. This finding supports the perception that there is 'missing inflation.'
Pass-through from headline to core inflation
Large changes in industry prices that affect headline inflation do not directly affect our weighted-median measure of core inflation. But past research suggests that non-core shocks to headline inflation can feed into core through indirect channels (e.g. Peersman and Robays 2009, ECB 2014). When the headline inflation shocks are changes in the prices of oil or other commodities, they affect production costs in many industries. In addition, headline inflation movements can influence nominal wage changes throughout the economy. Over time, changes in input costs and in wages feed into core inflation.
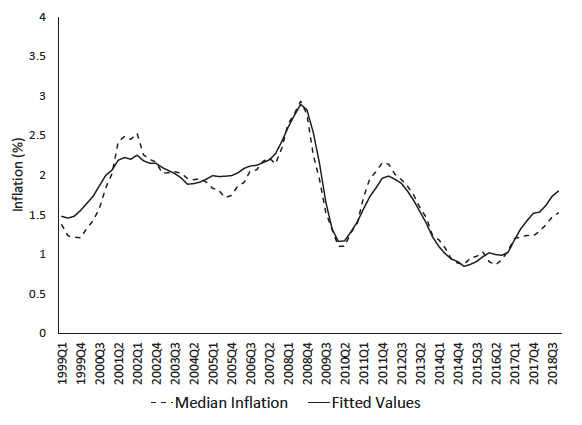
To capture these effects, we add one more variable to the Phillips curve. This is the average deviation of headline inflation from core inflation over the past year. The estimated coefficient on this variable is positive, confirming that headline-inflation movements pull core inflation in the same direction. Figure 3 compares actual core inflation to the fitted values from our augmented Phillips curve.
Figure 3 The fit of a Phillips curve for the euro area with headline inflation shocks, 1999-2018
Source: Ball and Mazumder (2020).
This version of the Phillips curve fits the data well. The fitted values closely match the decreases in actual median inflation after the two recessions and the increase in between. Missing inflation, while not entirely eliminated, is smaller. Actual median inflation falls below the fitted values only in 2017, and the deviations are modest. In the fourth quarter of 2018, the fitted value is 1.8% and actual median inflation is 1.5%.
We can better understand these results by looking again at Figure 1, which shows headline and median inflation. We see that headline inflation goes through a cycle in which it falls below median inflation from 2008 to 2009, then from 2010 it rises above median inflation until 2013, then falls below it again after 2013 until 2016. This cycle coincides with similar movements in world oil prices. Median inflation moves toward headline inflation in each part of the cycle, which explains why the Phillips curve fits better when we account for headline-to-core pass-through.
Conclusion
Many economists question whether a traditional Phillips curve can explain inflation in the euro area . ECB officials have suggested that inflation behaviour has been altered by structural changes in the economy, such as digitalisation and globalisation (Draghi 2019) and the growth of the service sector (Coeure 2019). Our research finds, however, that Friedman’s half-century-old Phillips curve fits the behaviour of core inflation – at least if that variable is measured well, and we account for the pass-through from headline inflation.
References
Ball, L and S Mazumder (2020), "A Phillips Curve for the Euro Area", ECB working paper 2354.
Bobeica, E and A Sokol (2019), "Drivers of Underlying Inflation in the Euro Area Over Time: A Phillips Curve Perspective", ECB Economic Bulletin.
Bryan, M and S Cecchetti (1994), "Measuring Core Inflation", in N G Mankiw (ed), Monetary Policy, University of Chicago Press.
Ciccarelli, M and C Osbat (2017), "Low Inflation in the Euro Area: Causes and Consequences", European Central Bank occasional paper 181.
Coeure, B (2019), The Rise in Services and the Transmission of Monetary Policy, 21st Geneva Conference on the World Economy, 16 May.
Draghi, M (2019), Twenty Years of the European Central Bank’s Monetary Policy, ECB Forum on Central Banking, Sintra, 17 June.
ECB Monthly Bulletin (2014), "Indirect Effects of Oil Price Developments on Euro Area Inflation", December.
Friedman, M (1968), "The Role of Monetary Policy", American Economic Review 58: 1-17.
Peersman, G and I Van Robays (2009), "Oil and the Euro Area Economy", Economic Policy 24: 603-651.


