Macroprudential policy has been widely adopted in advanced economies in response to the financial crisis. Cerruti et al. (2018) show that loan-to-value (LTV) limits on property lending are now used in two-thirds of advanced economies, up from a fifth a decade before. While aggregate household indebtedness (Almenberg et al. 2018)and the role of credit availability and speculative property bubbles (Mian and Sufi 2018) have received considerable attention, the evidence on euro area mortgage lending standards before and after the crisis has been limited. This column documents looser mortgage credit standards among those European countries that experienced a property boom-bust, relative to those that did not. On the wider effects of credit boom-busts, we find a strong correlation between credit constraints and household indebtedness. We also link property bubbles and credit tightening to changes in borrower composition.
What happened?
In a recent paper, we use the Household Finance and Consumption Survey (HFCS) (ECB 2013, 2016) to document the stark differences in the evolution of credit standards for those European countries that experienced a property boom-bust and those that did not (Kelly et al. 2018).1 We show that LTV ratios were around 10 percentage points higher on average in boom-bust countries in the period 2004–08 (after controlling for borrower composition and characteristics). After the bubble burst, LTVs came down rapidly in boom-bust countries, falling by 14 percentage points, bringing them more in-line with European averages.
However, looking at averages only tells part of the story. The biggest changes were for high-LTV loans, which we define as 90% or above (Figure 1). After the bubble burst, the reversal in these high-LTV loans is as dramatic as the rise for many countries (Figure 2).
Figure 1 Percentage of HMR loans with an LTV of 90% plus
Source: HFCS, waves 1 and 2 (ECB 2013, 2016).
Note: Loans for owner-occupier home purchase only. Excludes refinancing, renegotiating or topping-up existing loans.
Figure 2 Percentage of HMR loans with an LTV of 90% plus at origination (by country)
Source: HFCS, waves 1 and 2 (ECB 2013, 2016).
Note: RRE stands for ‘residential real estate’.
Apart from increasing the likelihood of going into negative equity when values fall, there is also a strong correlation between high LTV lending and measures of financial fragility, such as higher debt-service burdens. This is hardly surprising – lower down-payments mean that lower income, and often younger borrowers, can buy more easily (e.g. Ortalo-Magne et al. 2006). We show that in boom-bust countries, borrowers in the bottom half of the income distribution with low origination LTVs (<50%) use around one-quarter of their gross income on mortgage repayments. As we move up the LTV distribution (>90%), this rises to just under 40% of gross income.
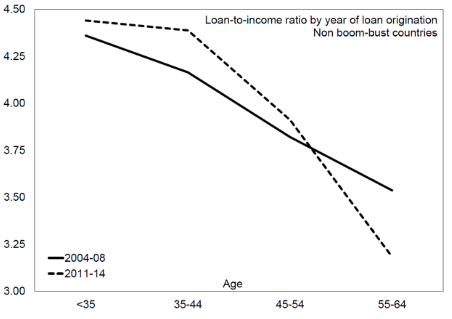
As well as LTV-caps, borrower-based macroprudential measures can limit loan-to-income (LTI) or debt-to-income ratios at origination (see the ESRB website for a full list of national policies). Here, the pre- and post-crisis contrast for boom-bust countries is stark, with a sharp contraction in LTI ratios for loans originating after the bust (Figure 3).2
Figure 3 Current HMR loan-to-income by age: Boom-bust versus non-boom-bust countries
Source: HFCS Waves 1 & 2 (ECB 2013, 2016).
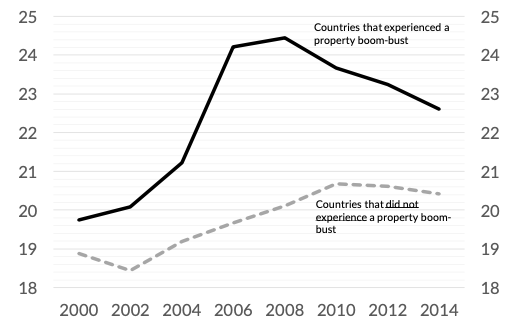
Extending loan repayments over a longer time period is one way to ease repayment burdens when debt grows faster than incomes. Average loan-terms in boom-bust countries grew by almost five years between 2000 and 2008, before falling again (Figure 4). In some countries, such as Ireland and the Baltic countries, average loan terms increased by as much as seven years during the credit expansion. Non-boom-bust countries were not immune to the increases in loan-terms during the same period, although the increases (approximately two years) are small by comparison. Furthermore, in some non-boom-bust countries, such as Austria and Germany, the average mortgage term does not changes at all.
Figure 4 Original loan-term (years), by year of origination
Source: HFCS, waves 1 and 2 (ECB 2013, 2016).
Notes: Loans for owner-occupier home purchase only. Excludes refinancing, renegotiating, or topping-up existing loans. Figures are simple cross-country averages of country-level averages. Country groups defined as in Figure 2.
Over-indebtedness and credit constraints
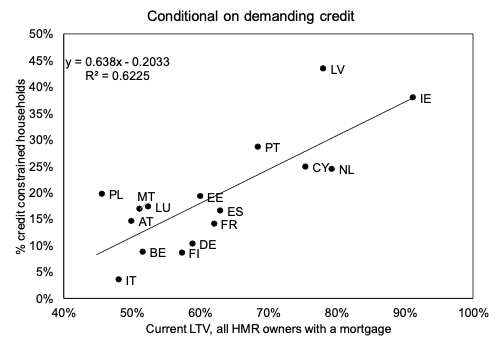
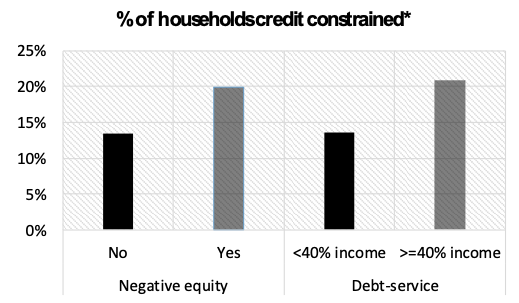
As Cecchetti and Schoenholtz (2018) and others point out, housing leverage is considered a key source of financial stability risk for the economy because it affects both financial institutions and households’ spending decisions. Other VoxEU columns have explored these effects for individual countries, such as Bunn and Rostem (2015) for the UK, and Gerlach-Kristen et al. (2013) for Ireland. In the HFCS, there is a positive correlation between credit constraints and household indebtedness. Households in high-debt countries, such as Ireland, Latvia, and the Netherlands are more likely to be credit constrained.3 To control for country-level supply factors, such as balance sheet problems in the financial sector, we estimate a regression at the household level that relates the incidence of credit constraints to indebtedness, borrower characteristics, and country fixed effects. The results suggest that it is at higher levels of indebtedness (i.e. being in negative equity) or higher debt repayment burdens (i.e. mortgage repayments exceeding 40% of gross income) that credit constraints are more prevalent (Figure 6).
Figure 5 Credit constraints and household indebtedness
Source: HFCS, waves 1 and 2 (ECB 2013, 2016).
Notes: Loans for owner-occupier home purchase only. Excludes refinancing, renegotiating, or topping-up existing loans.
Figure 6 Credit constraints, indebtedness and repayment burden
Source: HFCS, waves 1 and 2 (ECB 2013, 2016).
Notes: Households with an owner-occupier home-loan only. Coefficients on negative equity and high debt-service dummy variables from a regression controlling for household characteristics and country fixed-effects. (*)The sample is conditionalon applying for credit in the last three years, which is approximately one-fifth of households. The patterns in the unconditional sample are the same, although by definition you cannot be credit constrained if you do not apply for credit, so the levels are lower.
Conclusion
Whilst the HFCS is a good source of information on lending standards across countries and time, much like the Survey of Consumer Finance in the US, its usefulness will improve over time as new waves come on-stream (the third wave will be available end-2019). Whilst we focus on the evolution of credit standards and credit constraints in this column, our paper also shows how changes in credit alter the composition of buyers. In boom-bust countries in particular, LTV and LTI changes mean that, compared to earlier years, younger and lower-income borrowers have to save for longer before buying. In the majority of countries, the percentage of borrowers aged over 40 has increased significantly and the top two income quintiles account for roughly 70% of borrowers.
Authors’ note: The views expressed in this column are those of the authors and should not be attributed to the institutions with which they are affiliated.
References
Almenberg, J A Lusardi, J Säve-Söderbergh and R Vestman (2018), “Attitudes towards debt and debt behaviour”, VoxEU.org, 27 October.
Bunn, P and M Rostom (2015), “Household debt and spending in the UK”, VoxEU.org, 12 January.
Cecchetti, S and K Schoenholtz (2018), “Assessing housing risk”, VoxEU.org, 15 October.
Cerutti, E, S Claessens and L Laeven (2018), “The increasing faith in macroprudential policies,” VoxEU.org, 18 September.
ECB (2013), “The eurosystem Household Finance and Consumption Survey – Results from the first wave,” ECB Statistics Paper Series2.
ECB (2016), “The eurosystem Household Finance and Consumption Survey – Results from the second wave,” ECB Statistics Paper Series18.
Gerlach-Kristen, P, R Merola and C O'Toole (2013), “Consumption and credit constraints during financial crises,” VoxEU.org, 1 December.
Kelly, J, J Le Blanc and R Lydon (2018), “Pockets of risk in European Housing Markets: Then and now,” Central Bank of Ireland, Research Technical Paper Series 2018 (12).
Ortalo-Magné, F and S Rady (2006), “Housing market dynamics: On the contribution of income shocks and credit constraints,” Review of Economic Studies 73(2): 459–485.
Mian, A and A Sufi (2018), “Credit supply and housing speculation,” VoxEU.org, 19 August.
Endnotes
[1] The countries are shown in Figure 2. Boom-bust countries experienced a peak-to-trough fall in house prices of -36% on average (OECD), whilst non-Boom-bust countries saw only a negligible fall in house prices (-1.6%).
[2] We use regressions to show that, controlling for characteristics, the differences between the two periods are both economically and statistically significant. The average drop in LTIs is over 50 basis points for boom-bust countries. In contrast, non-boom-bust countries see a small increase in LTIs, by 10 basis points.
[3] Where credit constrained is defined by the ECB 2016as “a household that applied for credit and was turned down, and does not report successful later reapplication; a household that applied for credit and was not given as much as applied for; and a household that did not apply for credit because of a perceived credit constraint.”


