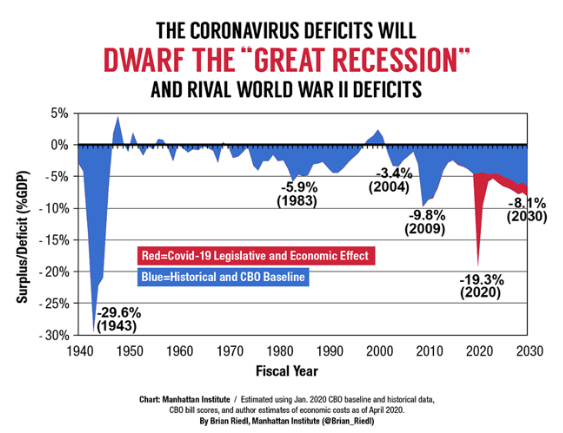
The COVID-19 pandemic has wreaked havoc on the global economy in 2020. To contain the spread of the virus, many countries shut down their economies by halting the movement of people and goods in the spring of 2020, leading about one-third of the world’s population to experience constrained life conditions due to these lockdowns. Consequently, the world economy contracted significantly.1 The fact that it hit China first induced significant supply chain contagion, intensifying the decline in manufacturing trade and output (Baldwin and Weder di Mauro 2020). To calm financial markets and avoid a possible free fall into a Great Depression, many countries, especially advanced economies (AEs), mobilised policy resources.2 According to the Manhattan Institute, the US alone will run a budget deficit of $4.2 trillion, or 19% of its GDP – the largest share since the deficit peak during WWII (Figure 1).3 That would push the US national debt held by the public to $41 trillion, or 128% of GDP, by 2030. This level of the national debt would exceed the level that occurred in 1946 (Figures 2 and 3).
Figure 1 US budget deficit
Source: Manhattan Institute (https://www.manhattan-institute.org/coronavirus-cbo-budget-deficit-projection)
Figure 2 US national debt
Source: Source: Manhattan Institute (https://www.manhattan-institute.org/coronavirus-cbo-budget-deficit-projection)
Figure 3 US national debt projection, September 2020
Source: Congressional Budget Office report, September 2020
With vaccinations for the virus possibly in sight, it is time to ponder an effective economic exit strategy into the post-COVID era. The road the US will take will have overarching repercussions on the global economy, given the size and the pivotal role of the US dollar as the anchor of the global financial system. To gain more insight on the road ahead, in Aizenman and Ito (2020) we compare two divergent US post-COVID economic strategies. The first is just ‘kicking the can down the road’ – that is, the US government could delay implementing needed macroeconomic adjustments and gamble for a resurrection of the economy while continuing to run lax monetary and expansionary fiscal policies. This choice may bring about short-term buoyancy to the US economy but will more likely come with growing exposure to the risk of a future global crisis, possibly worse than the 2008-2011 crisis.
Alternatively, the administration could adopt a two-pronged policy of reallocating the fiscal efforts first, while aiming at reaching a primary surplus over time. Specifically, it could retrench from expenditures oriented towards COVID-related challenges, and move towards expenses with a high social payoff (upgrading K-12 education, investing in medical infrastructures, etc.). With a lag, the restructured fiscal policy, together with a rise in tax collection, may reduce primary budget deficits, aiming to reach surpluses.
We analyse these divergent policies in terms of their implications on the gap between the interest rate paid to service government debt, denoted by r, and the growth rate of the economy, denoted by g. This gap, r – g, also known as the snowball effect, is the exponential growth of the public debt/GDP in countries with zero primary deficit. It is tempting to presume that the new normal for the future comprises negative snowball effects associated with secular stagnation, as in Summers (2014). Yet, there are several concerns to keep in mind. First, Wyplosz (2019) points out that negative snowball effects are not the rule; even in the US, r – g < 0 happened in 56% of the years (see Gros and Alcidi 2010 for debt snowball effects in Europe). Furthermore, the past performance of the US as the safe anchor of the global financial system does not guarantee maintaining the ‘exorbitant privilege’ status into the future (Gourinchas et al. 2010, Eichengreen 2011, Chiţu et al. 2014, Carney 2019). The two-pronged US post-COVID exit strategy discussed in our paper may mitigate the growing discontent with the dominance of the US dollar. Greater attention on the part of the US to scaling down its public debt overhang over time will mitigate the present centrifugal forces working towards multipolar global currencies discussed by Carney (2019). An additional concern is that the record of predicting future changes of the snowball effects is mixed, at best.4 Presuming that the new normal is a negative snowball effect may increase the risk of a deeper future crisis over time, as was the case in the late 1990s and early 2000s when the presumption of an enduring ‘Great Moderation’ permeated policymaking (see also Rogoff 2015).5
Specifically, we examine the interest-rate-growth differentials in the post-WWII period. In the period of 1946-1956, the post-WWII US fiscal policy facilitated global growth where the US, Western European countries, and Japan successfully grew while repressing the interest rate. Their snowball effect, r – g, was often negative during that period. This helped to load-off the public debt overhang associated with the war and reconstruction efforts. In contrast, during 1974-1984, the snowball effect became unsustainably high for many emerging market economies (EMEs), triggering a series of financial crises. Next, we investigate whether and to what extent the cost of serving the public debt affected real output growth. The flow cost of serving debt is estimated by the snowball effect times the public debt as a share of GDP. A higher flow cost of serving the debt may lead investors to question debt sustainability, raising the interest rate, reducing the growth rate, and further increasing the snowball effect. This negative feedback may induce costly market corrections, financial instability, and crisis. The emerging markets’ lost growth decade during the 1980s, and the euro area sovereign debt crisis affecting mostly the Southern euro area states illustrate these dynamics vividly.
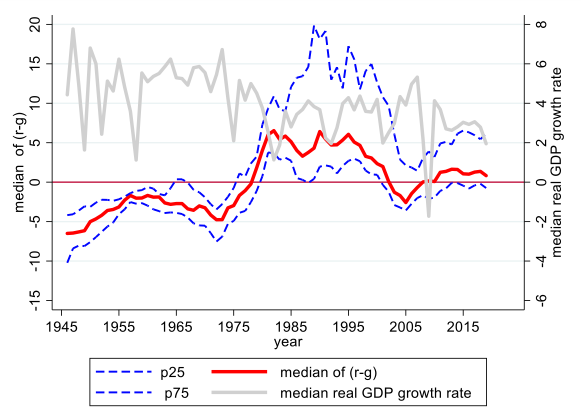
Figure 4 shows that the median interest rate growth differential, r – g, is mostly low and in the negative territory during the 1940s and 1950s.6 Thereby, the US, Japan, and Western European countries benefited from low costs of serving their public debt during the post-WWII recovery decades. The snowball differential continued to be in the negative territory during the 1970s. In the early 1980s, the differential rose up rapidly to the positive territory and mostly remains there until 2000. The 75th percentile (dotted blue) line hovers at high levels in the 1980s and 1990s, indicating that the top 25% of countries in the interest-rate-growth differentials faced very high costs of serving their public debt. These countries include mostly Latin American states, experiencing debt crises and hyperinflation spells during the 1980s. In the mid-2000s, the differential dropped towards negative figures, but rose up again to the positive territory in the 2010s.
Figure 4 The interest-rate-growth differential (percentage points)
The grey solid line in in Figure 4 is the median growth rate of real GDP (in local currency), measured by the right scale. A casual observation is that there is a negative correlation between real output growth and the interest-rate-growth differential. Our empirical work validates that a rise in the cost of external debt would lead (with lags of two to three years) to output growth slowdown, and these effects add up, explaining the lost growth effects of Latin America and other emerging markets during 1980s. A faster rise in the flow cost of serving external debt has a negative impact on output growth, and this effect is dampened if the country experiences real appreciation. Consequently, US post-COVID exit policies reducing the odds of rapid increase in snowball effects may reduce future volatility, stabilising and increasing the global growth rate.
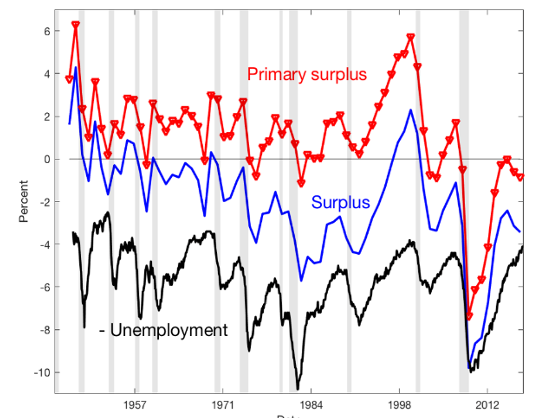
The history of the US after WWII provides a vivid example of the success of a two-pronged approach in facilitating the exit from a public debt overhang, stabilising the global economy, and solidifying the global role of the dollar. The rapid decline in public debt/GDP from 1946 to 1955, exhibited in Figures 2 and 3, was accommodated by financial repression inducing lower r, mild inflation (~ 4.2%), higher taxes, and robust GDP growth (Aizenman and Marion 2011, Reinhart and Kirkegaard 2012, Reinhart and Sbrancia 2015, Reinhart et al. 2015). Figure 5 vividly shows the sharp drop of WWII US fiscal revenue mobilisation from 50% GDP points in 1944 towards 20% by 1946. Starting in 1947, this large revenue contraction was followed by an upwards trend, increasing the fiscal revenue/GDP to 35% in the 1970s. Remarkably, the US government was running mostly primary surpluses during that period (Figure 6). These policies supported solid economic growth, reducing the public debt/GDP from 106% in 1946 to 23% in 1974.
Figure 5 Total government spending and revenues as a % of GDP7
Figure 6 US fiscal surpluses/GDP after WWII
Source: Cochrane (2020)
This post-WWII success story illustrates the feasibility and gains from a two-pronged fiscal strategy. Looking forward, reallocation of fiscal spending from fighting COVID’s medical and economic challenges towards physical, medical, and social infrastructures may provide a welcome boost to future growth. With a lag, following the resumption of robust growth, increasing taxes and reaching a primary surplus may stabilise the US and the global economy. Such a trajectory may solidify the viability and credibility of the US dollar as a global anchor, thereby stabilising emerging market economies and global growth.
References
Aizenman, J and H Ito (2020), “Post COVID-19 Exit Strategies and Emerging Markets Economic Challenges”, NBER Working Paper No. 27966, October 2020.
Aizenman, J and N Marion (2009), “Using inflation to erode the US public debt”, VoxEU.org, 18 December.
Aizenman, J and N Marion (2011), “Using inflation to erode the US public debt”, Journal of Macroeconomics 33(4): 524-541.
Baldwin, R and B Weder di Mauro (2020), Economics in the time of COVID-19: A new eBook, a VoxEU.org eBook, CEPR Press.
Ball, L and N G Mankiw (1995), “What do budget deficits do?”, In Proceedings-Economic Policy Symposium-Jackson Hole: 95-119, Federal Reserve Bank of Kansas City.
Barro, R J (1979), “On the determination of the public debt”, Journal of Political Economy 87(5, Part 1): 940-971.
Blanchard, O (2019), “Public Debt and Low Interest Rates”, American Economic Review 109(4).
Bohn, H (2008), “The sustainability of fiscal policy in the United States”, in R Neck and J-E Sturm (eds), Sustainability of public debt, Cambridge, MA: MIT Press, pp.15-49.
Calvo, G and R Loo-Kung (2010), “US recovery: a new ‘Phoenix Miracle’?”, VoxEU.org, 12 April.
Carney, M (2019), “The growing challenges for monetary policy in the current international monetary and financial system”, In Remarks at the Jackson Hole Symposium (Vol. 23, August).
Chiţu, L, B Eichengreen and A Mehl (2014), “One or multiple international currencies? Evidence from the history of the oil market”, VoxEU.org, 17 March.
Cochrane, J (2020), “Perpetuities, debt crises, and inflation”, The Grumpy Economist, 8 June.
Cordella, T, L A Ricci and M Ruiz-Arranz (2010), “Debt overhang or debt irrelevance?”, IMF Staff Papers 57(1): 1-24.
Eichengreen, B (2011), Exorbitant Privilege: The rise and fall of the Dollar and the Future of the International Monetary System, Oxford University Press.
Ghosh, A R, J I Kim, E G Mendoza, J D Ostry and M S Qureshi (2013), “Fiscal fatigue, fiscal space and debt sustainability in advanced economies”, The Economic Journal 123(566): F4-F30.
Gourinchas, P O, H Rey and N Govillot (2010), Exorbitant privilege and exorbitant duty, (No. 10-E-20), Tokyo: Institute for Monetary and Economic Studies, Bank of Japan.
Gros, D and C Alcidi (2010), “Is Greece different? Adjustment difficulties in southern Europe”, VoxEU.org, 22 April.
Reinhart, C and J Kirkegaard (2012), “Financial repression: Then and now”, VoxEU.org, 16 March.
Reinhart, C M, V Reinhart and K Rogoff (2015), “Dealing with debt”, Journal of International Economics 96: S43-S55.
Reinhart, C M and M B Sbrancia (2015), “The liquidation of government debt”, Economic Policy 30(82): 291-333.
Rogoff, K (2015), “Debt supercycle, not secular stagnation”, VoxEU.org, 22 April.
Summers, L (2013), “On secular stagnation”, Reuters Analysis & Opinion, 16 December.
Summers, L H (2014), “Reflections on the new ‘Secular Stagnation hypothesis’”, VoxEU.org, 30 October.
Wyplosz, C (2019), “Olivier in Wonderland”, VoxEU.org, 17 June.
Endnotes
1 According to the International Monetary Fund (IMF), as of June 2020, the world economy’s GDP is predicted to shrink by 4.9% in 2020, the largest shrinkage since the Great Depression of the 1930s. The economic toll is greater for advanced economies (AEs), which may shrink by 8.0% throughout the year – especially, the euro area and the UK that may both suffer a 10% reduction in their GDP growth rates. Emerging market economies (EMEs) and developing countries are facing a severe reality as well – their GDP as a group is forecasted to fall by 3.0%.
2 The stimulus packages among AEs have amounted to about $4.2 trillion in 2020, leading these economies to run budget deficits of almost 17% of their GDP. Their central banks rapidly expanded balance sheets to 10% of GDP.
3 The Congressional Budget Office (CBO) projected that the baseline (pre-COVID) deficit will be $1 trillion in 2020. It estimates the total deficit will be $3.7 trillion for the year.
4 While ‘Secular stagnation’ gained prominence following Summers (2013) analysis, it occurred five years after the Global Crisis, a backward-looking perceptive interpretation of the ‘great moderation’ and the on-set of demographic transitions, at times when concerns regarding the future of the dollar system were muted.
5 Barro (1979), Ball and Mankiw (1995), and Bohn (2008) noted that some advanced-country governments, notably the US, paid down a substantial portion of their debt by exploiting the differential between the interest rate on government debt and the growth rate of the economy. They caution that a government running a debt-Ponzi scheme when r < g might be subsequently faced with a sudden interest rate rise, necessitating a sharp and painful fiscal contraction. Calvo and Loo-Kung (2010) raised sustainability concerns in the context of the recovery from the Global Crisis. See also Aizenman and Marion (2011), Reinhart and Sbrancia (2015) and Reinhart et al. (2015) for empirical analysis of managing exits from public debt overhangs. Cordella et al. (2010) looked at debt overhang versus debt intolerance, Ghosh et al. (2013) analysed debt sustainability.
6 Our sample is composed of 23 traditional OECD countries and 34 EMEs. For the interest rate, we use the ten-year government bond yields for the countries for which such data are available. The long-term interest rate data is limited in the case of EMEs, especially those in Latin America and East Asia. Hence, to maximise the country coverage, we also use the lending rate. We measure potential output growth (g) with the growth rate of potential nominal GDP in US dollars for which we use nominal GDP that is smoothed by applying the Hodrick-Prescott filtering method.
7 Sources include: https://www.usgovernmentrevenue.com/revenue_chart_1960_2018USp_18s1li011lcn_F1fF0sF0l; https://www.usgovernmentrevenue.com/revenue_chart_1792_2018USp_18s1li011lcn_F1fF0sF0l; https://en.wikipedia.org/wiki/Government_spending_in_the_United_States#/media/File:Government_Revenue_and_spending_GDP.png


