Italy is often regarded as the sleeping beauty of Europe -- a country rich in talent and history, but suffering from a long-lasting stagnation. Italian per-capita income as percentage of the EU15 average has steadily declined since 1994, reaching 84% of EU15 average in 2012. However, this pattern is a novelty compared to previous decades. Italy was the best growth performer among major European partners in the 70s and 80s, but in the 90s and the 2000s it turned to be the worst performer. Why did that happen?
The answer to this question is complex and embraces many socio-economic dimensions. Nevertheless, one of the key causes predominantly stressed in the public debate is that Italy declined because it lost its competitiveness. The focus on competitiveness is so strong that the guidelines for the Italian 2014 Budget highlight two priorities:
- Reinforce the current recovery; and
- Intervene on the factors that limit competitiveness.
Unlearning to produce
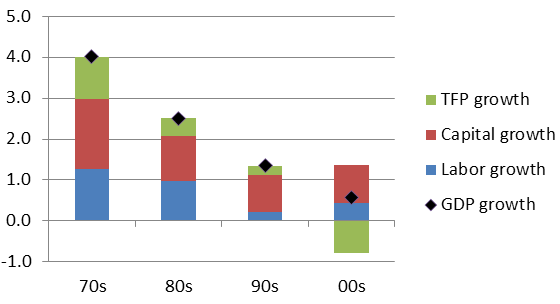
The guidelines are surprisingly silent on what is arguably the main driver of both priorities – productivity growth. Figure 1 shows a growth accounting decomposition for Italy in the past four decades. Total factor productivity (TFP) growth shrank throughout the decades, turning negative in the 2000s. As TFP measures how efficiently given amounts of capital and labour are used, its negative growth signals an unprecedented reduction in the ability of Italy to turn its productive resources into value added.
Figure 1. Contribution to value added growth, Italy
Data: EU-Klems.
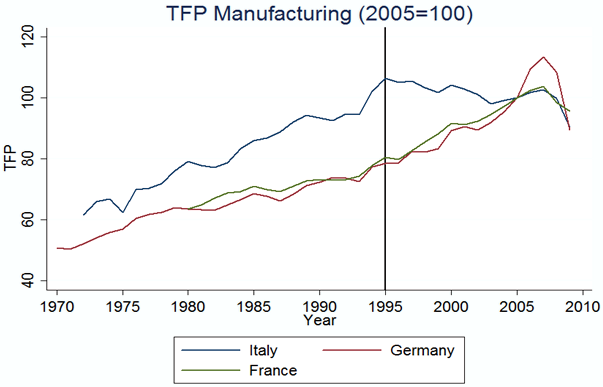
The TFP dynamics in the manufacturing sector is quite emblematic of the Italian decline. Figure 2 shows a dramatic slowdown in TFP growth since the mid Nineties for Italy compared to France and Germany.
Figure 2. TFP and labour productivity in selected countries, 1970-2010
Data: EU-Klems.
Resource misallocation
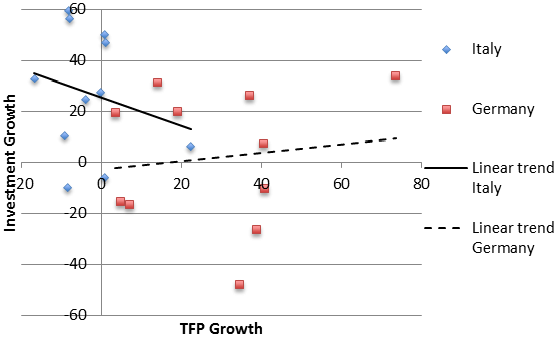
Another message of Figure 2 is that the stock of capital and labour kept on growing. Hence, Italian stagnation must be due to their wrong allocation across alternative uses. Figure 3 shows that, indeed, between 1995 and 2006 Italy invested more in sectors that experienced lower TFP growth, whereas the opposite happened in Germany. This is prima facie evidence of resource misallocation during the period of observation.
Additional tentative evidence of resource misallocation can be gauged by combining TFP data with information on private loans by branch of economic activity, collected by the Bank of Italy. This reveals basically no correlation between loans growth and TFP growth across sectors between 1999 and 2007 (the correlation coefficient at a two-digit sectoral level is 0.07).
Figure 3. Investment and TFP Growth, Italy vs. Germany (1995-2006; 2 digit manufacturing sectors)
Data: EU-Klems.
How costly may such misallocation be? A tentative answer can be given by zooming into manufacturing, and applying a standard procedure due to Olley and Pakes (1996) to firm-level data from Bartlesman, Haltiwanger, and Scarpetta (2009). This reveals that in Italy, the TFP index in manufacturing is 5.77% lower than if productive resources were randomly allocated across firms. In other words, by taking capital and labour away from firms and then throwing them back to firms at random, Italian manufacturing productivity would increase by almost a hefty 6%. This is additional evidence of sizeable resource misallocation.
Why is it not labour-market rigidity?
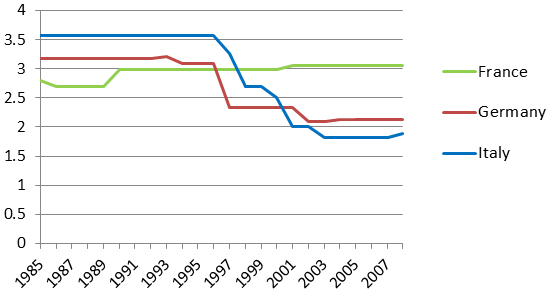
A popular explanation of resource misallocation is labour market rigidity. The idea is that a rigid labour market affects productivity by hindering labour reallocation towards more productive firms and sectors. However, this is a dimension on which Italy has substantially intervened in the last twenty years. According to the OECD synthetic index, labour market rigidity in Italy has been steadily falling since the mid-90s (exactly when TFP growth starts to stagnate), and is now lower than in Germany and France (Figure 4). Hence, this aspect is unlikely to be the main cause of the productivity slowdown shown above.
Figure 4. Strictness of overall employment protection
Data: OECD.
Inadequate management practices and the digital divide
There is a general consensus that ICT intensity is one of the main drivers of the productivity acceleration that the US experienced with respect to Europe since the mid-nineties (e.g. van Ark, O’Mahony, and Timmer 2008). Thus, an alternative reason why Italian productivity growth reached a standstill in the same years could be limited ICT penetration. Figure 5 reports the share of ICT investment on total investment for Italy, France, and Germany for the available years. It clearly shows that since the mid-nineties Italy has no longer kept the pace of the other countries.
Figure 5. Share of ICT investment in non-residential fixed capital formation
Data: OECD – Productivity database.
Why that happened is not yet clear. A possible reason is the ability of management to adjust to the new economy. For example, Bloom, Sadun, and Van Reenen (2012) show that management practices greatly affect ICT penetration and exploitation. This is particularly true in the case of practices related to human resources.
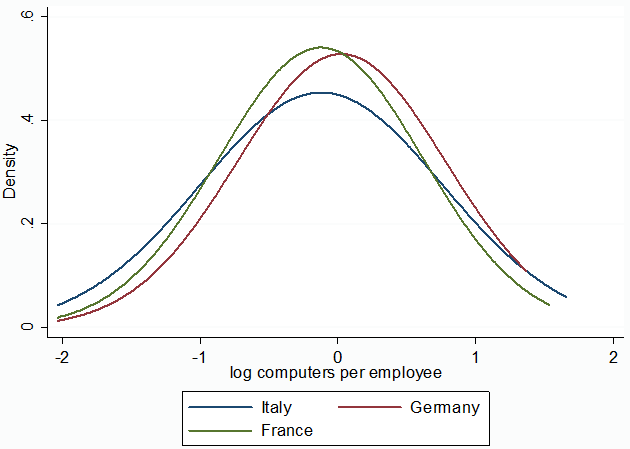
Figure 6 plots the probability of randomly picking a firm at any given level of ICT intensity as measured by the number of computers per employee. The figure shows that the probability of randomly picking a firm with low ICT intensity is higher in Italy than in France, and higher in France than in Germany. Vice versa, the probability of randomly picking a firm with high ICT intensity is lower in Italy than in France, and lower in France than in Germany.
Figure 6. Computer per employee, firm level density distribution
Data: Bloom, Sadun, Van Reenen (2012).
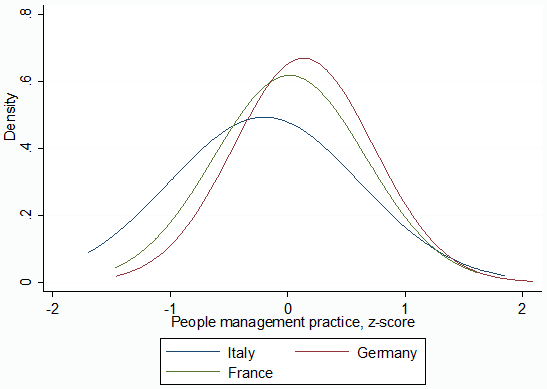
Figure 7 looks at what Bloom, Sadun, and Van Reenen (2012) call the “z-scores”, capturing the quality of management practices from the perspective of people management, such as managing human capital, rewarding high performance, removing poor performers, and promoting high performers. The figure shows that Italy has clearly lower z-scores due to a few facts:
- Italian firms promote workers primarily on tenure, rather than actively identifying and promoting top performers;
- Managers tend to reward people equally, irrespective of performance level, rather than providing targets with performance-related accountability and rewards;
- Poor performers are more rarely removed from their positions; and
- Senior managers, rather than being evaluated on the strength of talent pool they actively build, are more likely to not see attracting and developing talents as a priority.
Figure 7. People-management practice, firm-level density distribution
Data: Bloom, Sadun, Van Reenen (2012).
The types of management practices Italian firms get wrong are precisely those that Bloom, Sadun, and Van Reenen (2012) have shown to hinder ICT penetration and exploitation. Combined with the prominent role that ICT had on productivity growth in the last 20 years, this can be a relevant explanation for the Italian stagnation. Reducing labour-market rigidity is not enough in the presence of rigid non-meritocratic management practices. Italy is unlearning to produce because it seems not to manage change properly.
References
Bartelsman, Eric, John Haltiwanger, and Stefano Scarpetta (2009) "Measuring and Analyzing Cross-country Differences in Firm Dynamics" in Producer Dynamics: New Evidence from Micro Data, National Bureau of Economic Research: 15-76.
Bloom, Nicholas, Raffaella Sadun, and John Van Reenen (2012) “Americans do IT better: US multinationals and the productivity miracle”, The American Economic Review, 102 (1): 167-201.
Olley, Steven, and Ariel Pakes (1996) “The dynamics of productivity in the telecommunications equipment industry”, Econometrica 64 (6): 1263-97.
Van Ark, Bart, Mary O’Mahony, and Marcel Timmer (2008) “The productivity gap between Europe and the US: trends and causes”, Journal of Economic Perspectives 22 (1): 25-44.

